
Gradio is an open-source library for building easy-to-use and easy-to-share applications using only Python. It is especially intended for Machine Learning projects and seeks to make testing, sharing, and showcasing models simple and intuitive.
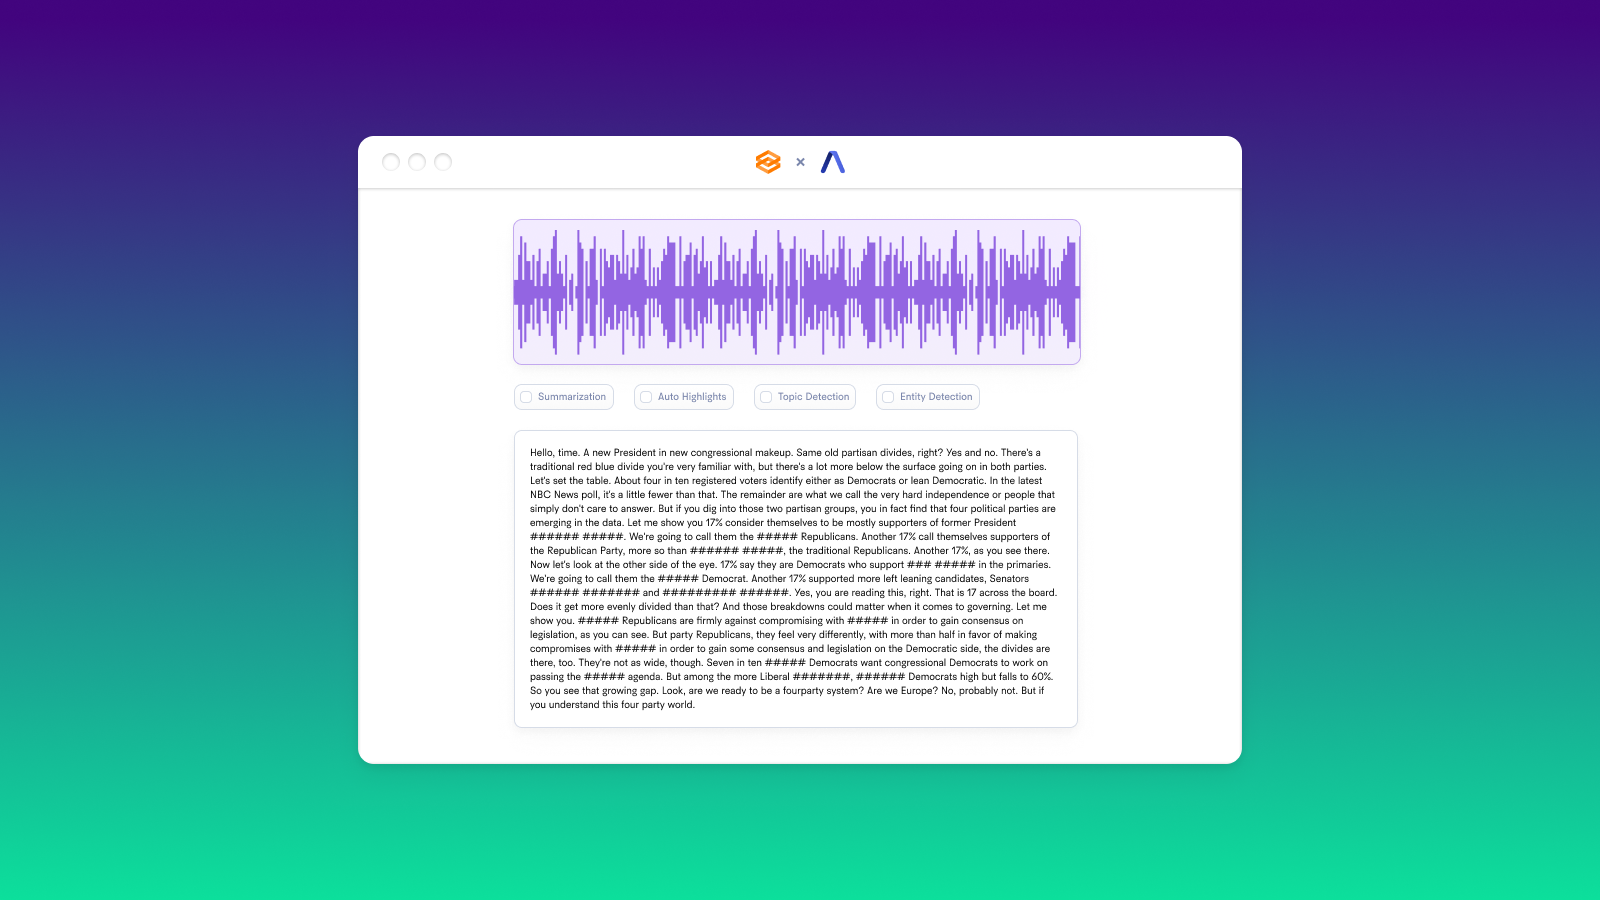
In this tutorial, we'll learn how to use Gradio to build the below Audio Intelligence Dashboard, which will allow us to analyze an audio file or recording using Deep Learning to obtain a variety of intelligent insights.
After submitting a file, you will be able to view the Audio Intelligence insights like automatic highlights, summaries, and detected topics, in an easily digestible way:
First, we'll learn how to use the Audio Intelligence Dashboard and parse the results, then we'll learn how to build the Dashboard with Hugging Face's Gradio, and finally we'll deploy the Dashboard using Hugging Face's Spaces. Let's get started!
How to Use the Dashboard
In this section, we'll learn how to submit audio files for analysis using the Dashboard, which you can find here. If you just want to see an example output, jump down to Examining the Results. If you want to go right to the implementation, jump down to Building the Dashboard UI with Gradio.
Launch the Dashboard
The Dashboard can be accessed in one of two ways. The first way requires no setup - simply go to the project Space, which hosts a publicly accessible version of the Dashboard. If you are using this method, you can jump down to the next section now.
The second way to access the Dashboard requires some setup, but allows you to run it locally for better performance. You will need Python 3, git, pip, and virtualenv installed for this method. Simply execute the below commands in the terminal to download the project repository from GitHub and run the Dashboard:
# Clone the repo
git clone https://github.com/AssemblyAI-Examples/audio-intelligence-dashboard.git

# Enter repo
cd audio-intelligence-dashboard

# Create virtual environment
virtualenv venv

# Activate virtual environment - MacOS/Linux
source venv/bin/activate

# Activate virtual environment - Windows
.\venv\Scripts\activate.bat

# Install requirements to virtual environment (will take a few minutes)
pip install -r requirements.txt - will take a few minutes

# Enter app directory
cd app

# Runn app (made need to use `python3` instead of `python`)
python app.py
The terminal will display a local URL at which the app can be accessed. Enter this URL in a browser to access the app.
Dark/Light Mode Note
Gradio has a "dark" mode and a "light" mode, which changes the default look of an app. Depending on your OS and browser, the Dashboard may display in dark mode. In Gradio 3.2, there is no way to force an app to display as on theme or another in Python. You can, however, force light mode by appending ?__theme=light to the URL output by running app.py.
The Audio Intelligence Dashboard is intended to be run in light mode, so if you see dark mode when running locally, try the above method to force the app to display in light mode
Enter AssemblyAI Key
The "engine" that will perform our Audio Intelligence analyses is the AssemblyAI API, so first we'll need an API key - you can find yours or get one for free here. Go to your AssemblyAI Dashboard and click the value under Your API key to copy its value.
Now go back to the Audio Intelligence Dashboard and paste your copied key into the API Key field.
Important Note
Never share your API key with anyone or upload it to GitHub. Your key is uniquely associated with your account and should be kept secret.
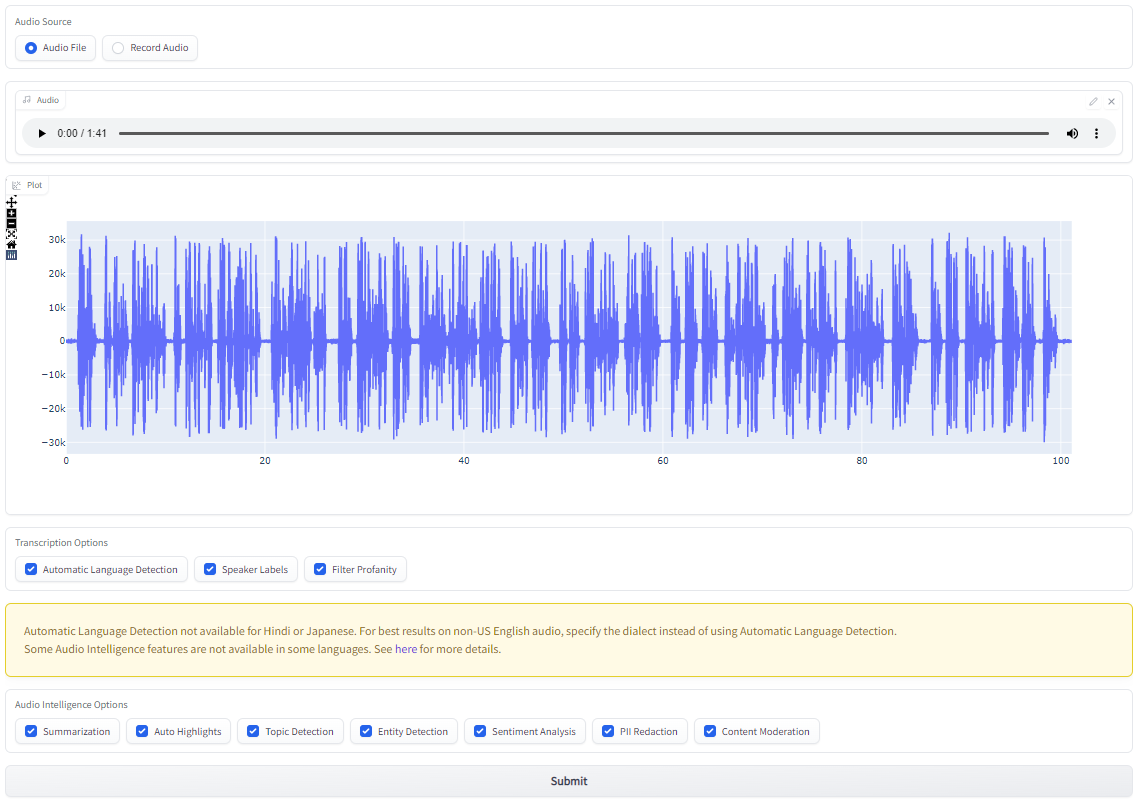
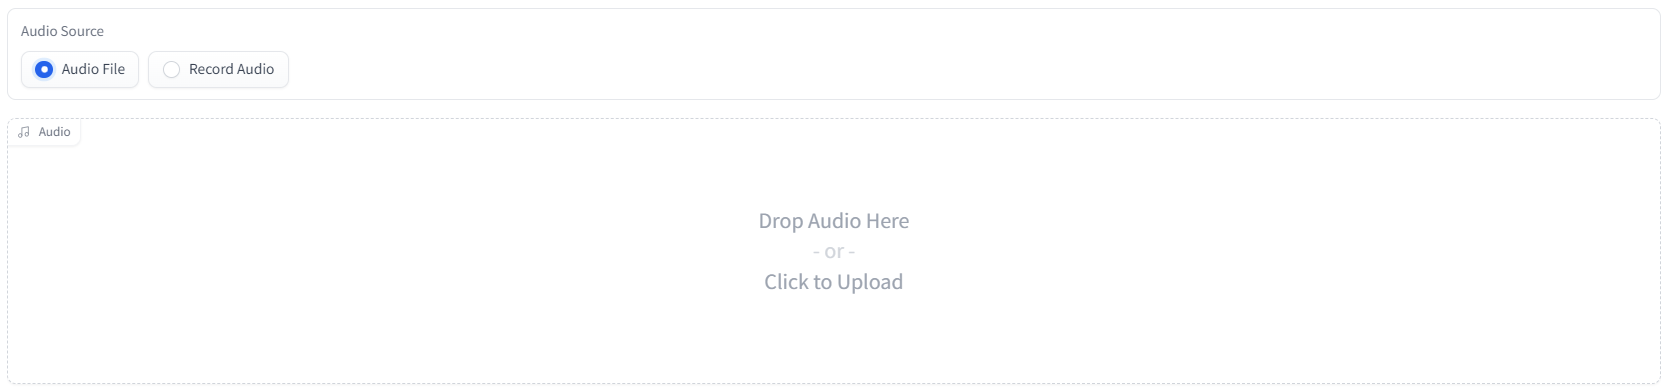
Upload or Record a File
Now we need to specify the audio that we would like to analyze. Under Audio Source, select either Audio File if you would like to use an audio file stored on your device, or Record Audio to record a file to use. Below we can see a file being drag-and-dropped for upload.
Choose Transcription & Audio Intelligence Options
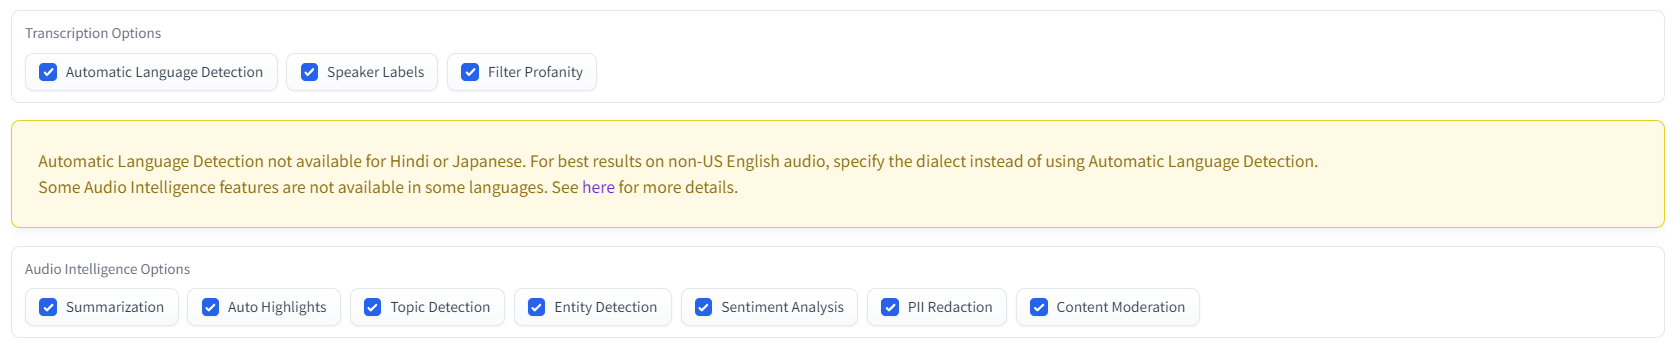
Now that we've specified the audio we would like to analyze, we must specify what types of analyses we would like to run. All options are selected by default, but you can deselect any analyses you are not interested in. Information about each option can be found in the Descriptions dropdown below.
Descriptions
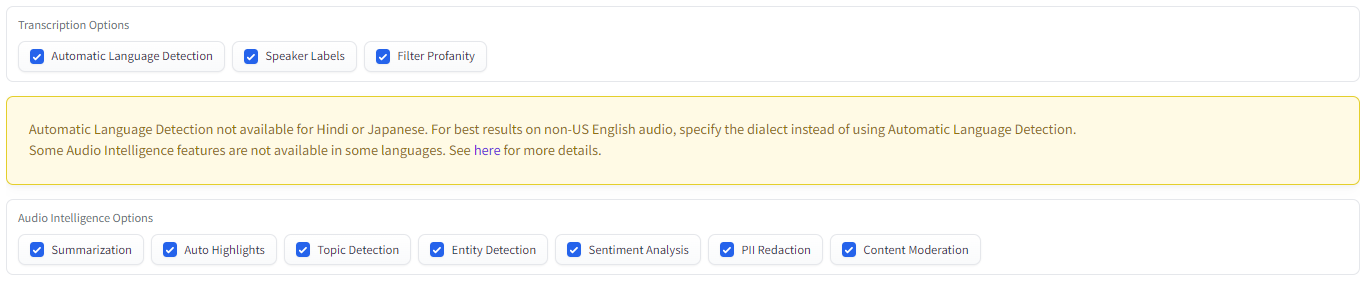
- Transcription Options
- Automatic Language Detection will automatically detect the language spoken in the audio.
- Speaker Labels will identify different speakers in the audio and determine which sentences are spoken by which speaker.
- Filter Profanity will redact identified profanity.
- Audio Intelligence Options
- Summarization will generate summaries of each distinct section of the audio.
- Auto Highlights will identify key words and phrases in the transcript.
- Topic Detection will determine which topics are discussed in the audio.
- Entity Detection will detect entities like locations and organizations in the audio.
- Sentiment Analysis will determine the polarity and degree of sentiment associated with each sentence in the transcript.
- PII Redaction will redact Personal Identifiable Information (PII).
- Content Moderation will determine the degree to which different sensitive topics are discussed in the audio.
Submit
After specifying the audio to analyze and which analyses to run, simply hit Submit to submit the audio for analysis. Depending on the length of the audio, this may take some time. Expect the analysis to take about 15-30% of the audio file's duration, with a minimum of about 20 seconds.
Examining the Results
After the audio analysis is complete, the results will be displayed in the tab group at the bottom of the page. Let's take a look at each tab now and examine the results from an example audio file.
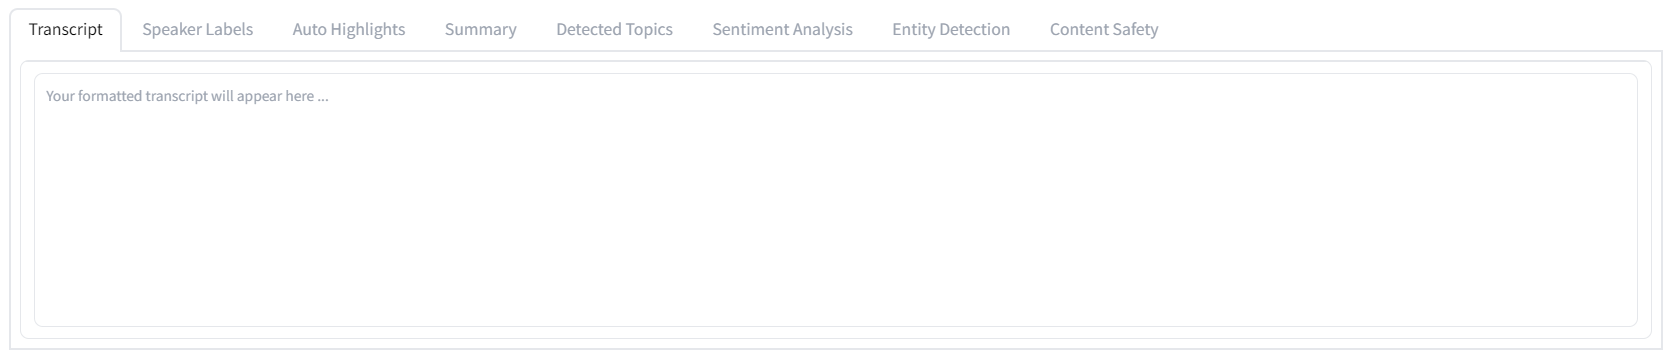
Transcript
The first tab shows the most basic result, which is a formatted transcript of the audio.
You'll notice that several values have been redacted. In particular, the PII Redaction feature is set to redact medications, bodily injuries, names, and money amounts. Therefore,
- "so I fell back and broke my wrist" has been transcribed as "so I fell back and ##### ## #####"
- "cost me almost $1,000" has been transcribed as "cost me almost $#,###"
- "I've had to take Advil all week" has been transcribed as "I've had to take ##### all week"
Further, the Filter Profanity option is the cause for the transcript reading "My wrist still feels like s***".
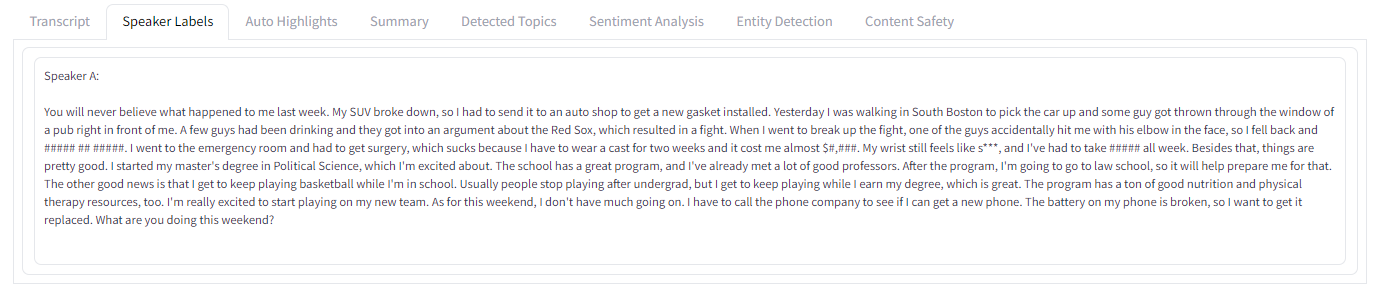
Speaker Labels
The second tab shows the same transcript, but this time displays the speaker of each part of the audio above the corresponding text in the transcript. Speakers are identified as Speaker A, Speaker B, etc. In this case, there is only one speaker, so the entire transcript is attributed to Speaker A.
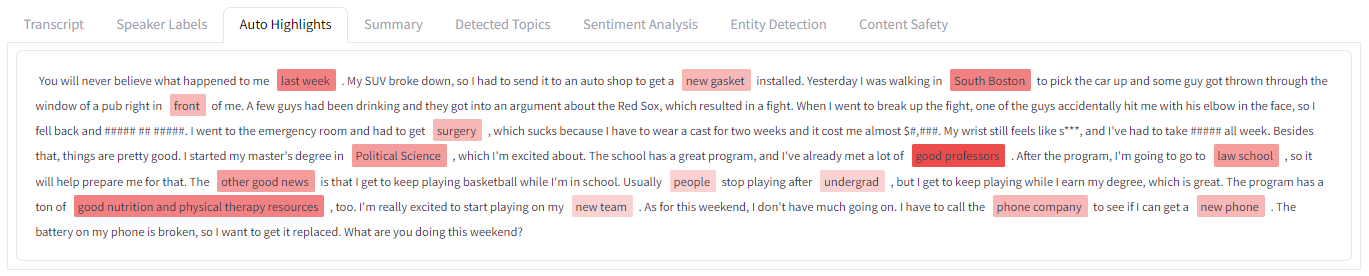
Auto Highlights
The third tab displays the results from the Auto Highlights analysis. Key words and phrases are identified and highlighted, with the opacity of the highlight corresponding to the relevancy of the word/phrase.
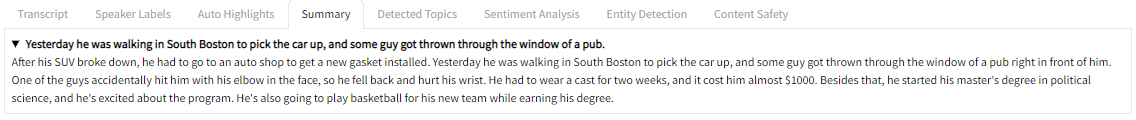
Summary
The fourth tab displays summarization results. The audio is automatically split into conceptually distinct sections, and then each section is summarized by a bolded headline. In this case, only one section is determined to exist, resulting in only one headline as can be seen below:

Clicking on any given headline will display a more detailed summary of that section:
Detected Topics
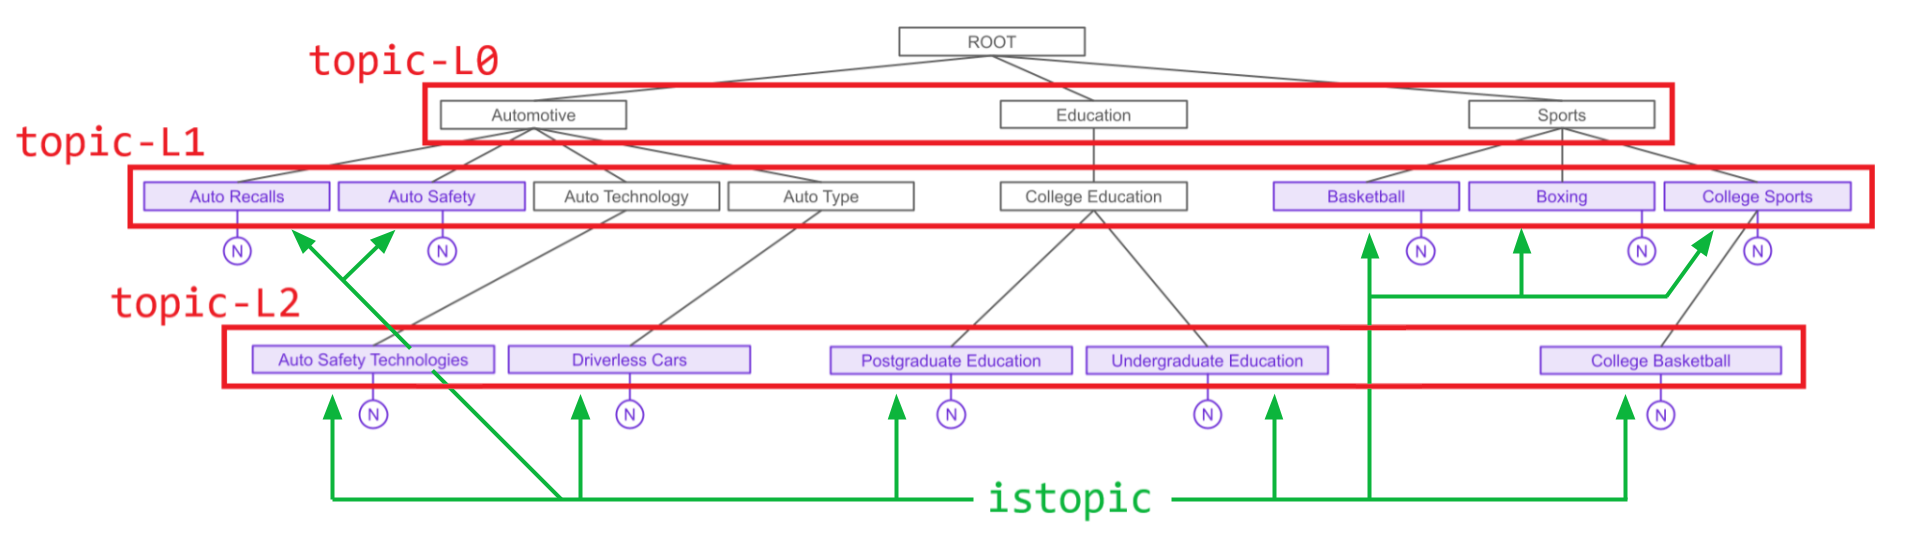
The fifth tab displays topics within the IAB taxonomy that were detected in the audio. Each topic's subtopics are listed below it, indented, where any topic highlighted in purple was detected to be discussed in the audio.
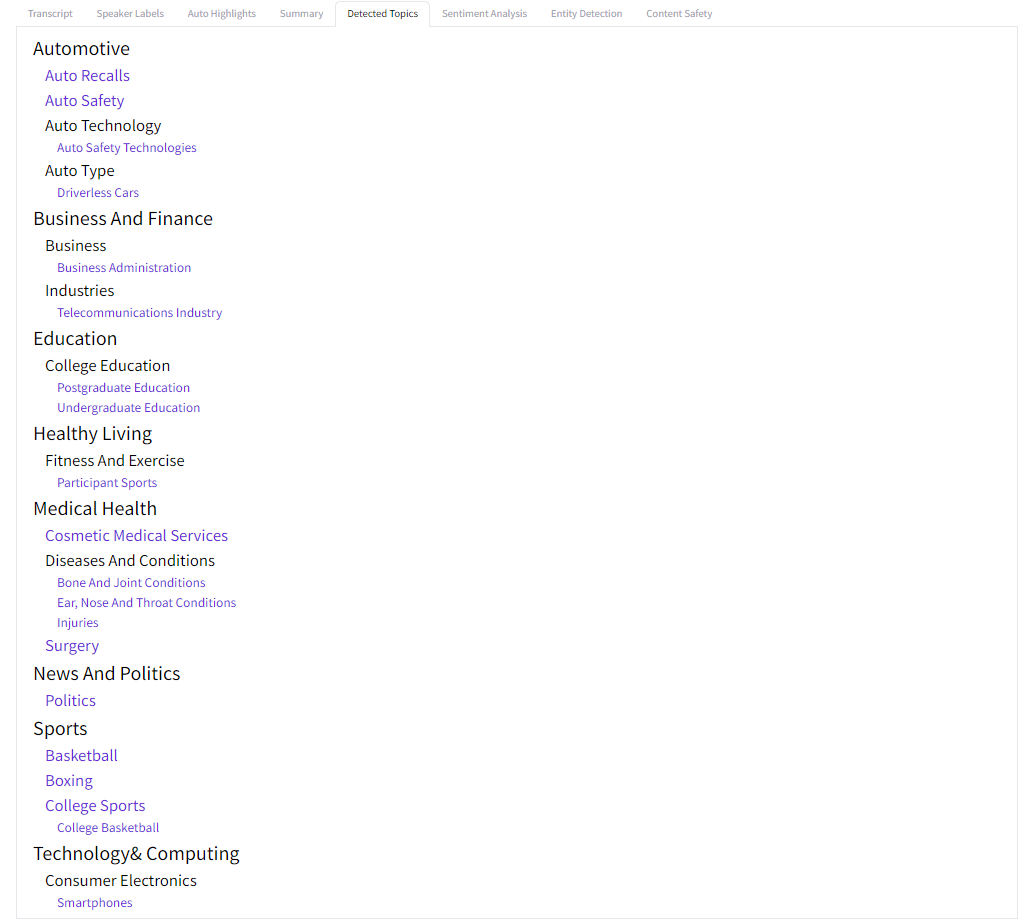
For example, the topics "Postgraduate Education" and "Undergraduate Education" were both detected topics and fall under the category "College Education", which falls under the category "Education", despite neither of the latter two topics themselves being detected.
On the other hand, "College Basketball" falls under the category "College Sports" which was itself a detected topic (as indicated by its purple color) that falls under the category "Sports", which was not itself detected.
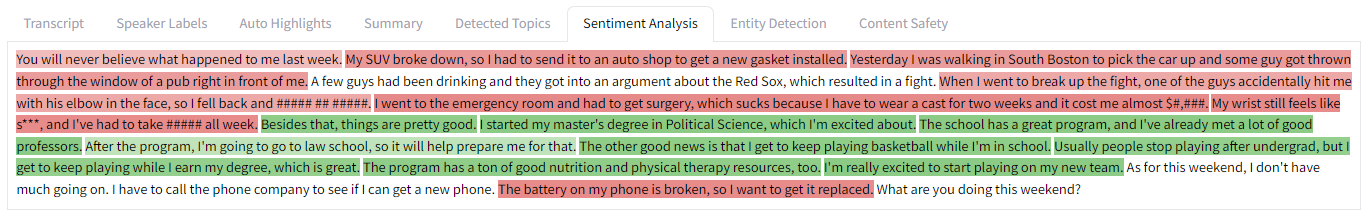
Sentiment Analysis
The sixth tab displays the result of sentiment analysis on the audio. Each sentence of the transcript is either
- Highlighted red for negative sentiment
- Highlighted green for positive sentiment, or
- Has no highlight for neutral sentiment.
The opacity of the highlight corresponds to the degree of the sentiment.
Entity Detection
The seventh tab displays entities that were detected in the audio. Each entity type is displayed in purple with detected instances listed below. The detected entity is highlighted in yellow, surrounded by several words on either side for context.
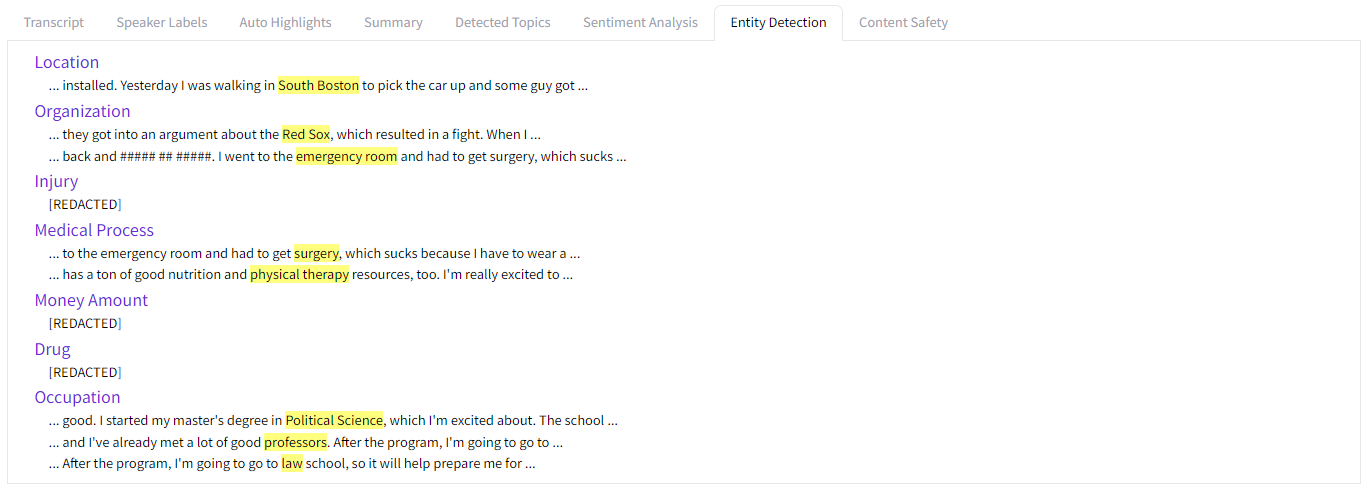
For example, two entities mentioned in the audio were detected to be "Medical Processes" - "surgery" and "physical therapy". Each of these entities are highlighted in yellow below the corresponding entity type.
Some highlights have display as "[REDACTED]" because the PII Redaction feature is on.
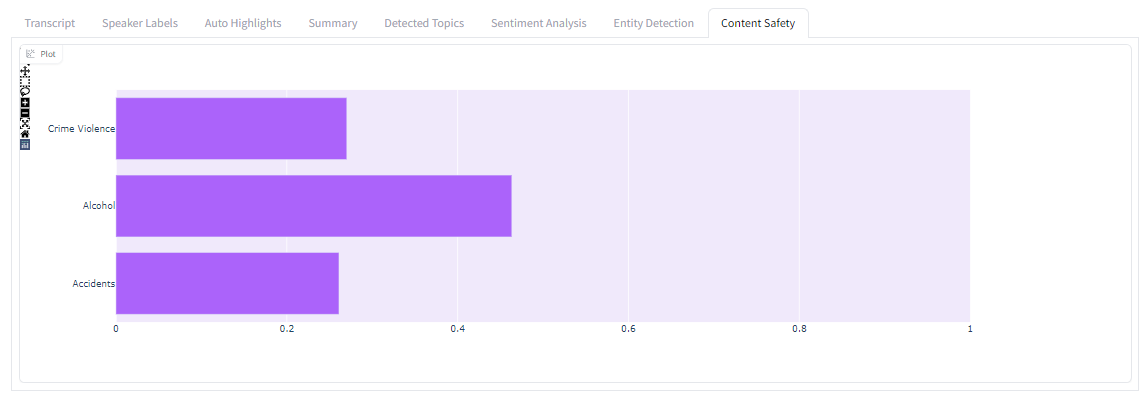
Content Safety
The eighth and final tab displays a summary of sensitive topics that were detected in the audio. Each sensitive topic that is detected is listed on the left of the bar chart, with the length of its bar corresponding to the degree to which the topic appears in the audio as a whole, with 0 being the minimum value and 1 being the maximum.
In our example, we see the topics "Crime Violence", "Alcohol" and "Accidents" were each detected, with "Alcohol" being the most relevant/present.
Summary
That's all it takes to perform a wide range of insightful analyses on an audio file using the Audio Intelligence Dashboard! Feel free to check out the AssemblyAI documentation to learn more about each of the above analyses.
Now that we've gone through usage of the Dashboard, let's learn how Gradio works in preparation for building the Dashboard ourselves. If you're already familiar with Gradio and want to go right to the implementation, jump down to Building the Dashboard UI with Gradio.
Introduction to Gradio
In this section we'll check out a brief overview of Gradio to orient ourselves on its structure / philosophy before diving into the Audio Intelligence Dashboard implementation.
Gradio Overview
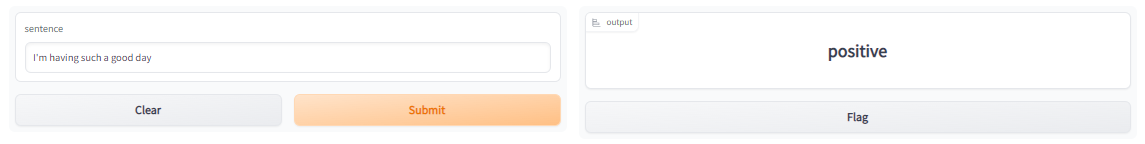
Let's take a look at a very basic Gradio example, where we implement an application for a rudimentary sentiment analysis model.
import gradio as gr

def analyze_sentiment(sentence):
    if "good" in sentence:
        return "positive"
    elif "bad" in sentence:
        return "negative"
    else:
        return "neutral"

app = gr.Interface(fn=analyze_sentiment, inputs="text", outputs="label")

app.launch()
First, we define the analyze_sentiment method, which is our Machine Learning "model" that takes in a sentence and returns a sentiment classification of "positive", "negative", or "neutral". Next, we define the app with gr.Interface(), specifying the function that constitutes the "model" along with its input and output types. Finally, we simply use app.launch() to launch the application.
After running the above script, a local URL at which you can access the app will be displayed in the terminal. Paste this URL in a browser to open the app. You can then put in an example input and see what the model produces as an output
That's all it takes to build a simple app with Gradio!
Gradio Blocks
For more complicated applications, Gradio affords a lower-level Blocks API that allows for finer control. We will be using Blocks to build the Audio Intelligence Dashboard, so let's familiarize ourselves with it now. The above app has been recreated with Blocks in the code below:
import gradio as gr

def analyze_sentiment(sentence):
    if "good" in sentence:
        return "positive"
    elif "bad" in sentence:
        return "negative"
    else:
        return "neutral"

with gr.Blocks() as app:
    sentence = gr.Textbox()
    sentiment = gr.Label()
    submit = gr.Button()

    submit.click(fn=analyze_sentiment,
                 inputs=sentence,
                 outputs=sentiment)

app.launch()
All of the code is the same, except the app = gr.Interface(...) line has been replaced with the with gr.Blocks() as app: block. Everything we define within this block is a component of the application. We instantiate:
- A
gr.Textbox()element, which creates a text area to enter or display a string, for our input sentence - A
gr.Label()element, which creates an area to display a classification label, for our output sentiment classification, and - A
gr.Button()element, which creates a clickable button, for running the sentiment analysis.
After instantiation, the components exist without any relationship to each other. To add functionality, we add the submit.click() method, which tells the app what to do when the submit button is clicked. In our case, we want to run the function analyze_sentiment, using the sentence Textbox as an input and the sentiment Label as an output. Running this script yields the following application:
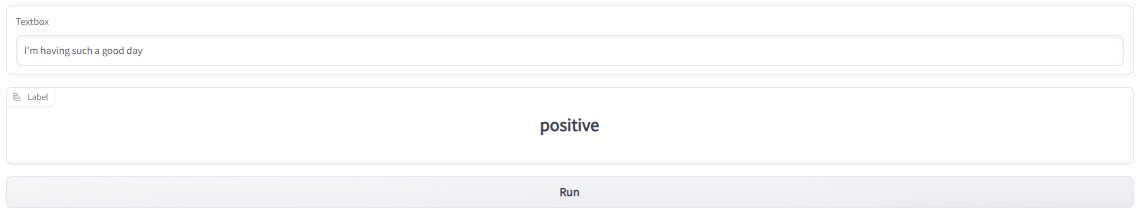
We now have an application that is functionally equivalent to the gr.Interface() method that we used above!
Gradio Blocks - Finer Control
We can get more creative using Blocks. Below we see a modified version of the above Blocks example.
import gradio as gr

def analyze_sentiment(sentence):
    if "good" in sentence:
        label = "positive"
    elif "bad" in sentence:
        label = "negative"
    else:
        label = "neutral"
    return gr.Label.update(value=label, visible=True)

with gr.Blocks() as app:
    with gr.Row():
        sentence = gr.Textbox(label='Input Sentence',
                              placeholder="Enter a sentence here ...")
        sentiment = gr.Label(visible=False)

    submit = gr.Button()

    submit.click(fn=analyze_sentiment,
                 inputs=sentence,
                 outputs=sentiment)

app.launch()
Let's take a look at each modification and what it does.
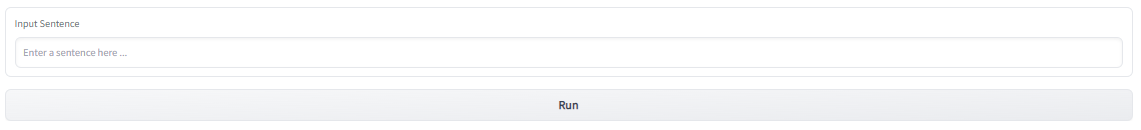
First, by adding keyword arguments to the gr.Textbox() constructor, we can add a label to the element and placeholder text to the textbox, and by adding visible=False to the gr.Label() constructor, we can make the label component invisible by default. This is what the app now looks like upon loading:
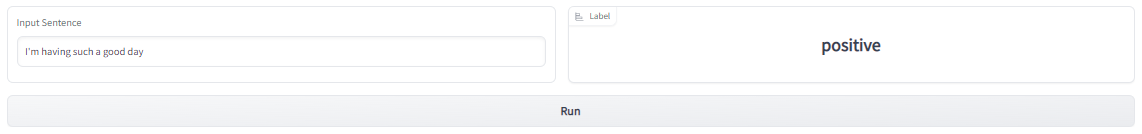
Next, rather than return a string in analyze_sentiment, we return the gr.Label.update() method, which allows us to update specific attributes of a gr.Label. In our case, we update the value as before, but also specify visible=True to make the component visible after running the sentiment analysis. This is what the app looks like after submitting a sentence for analysis:
The with gr.Row(): block tells the app to put the Textbox and Label components side by side, rather than placing them vertically which is the default layout.
Now that we understand how Gradio Blocks work, we can finally jump in to building the Audio Intelligence Dashboard ourselves! First, we'll start by defining the user interface (UI), and then we'll implement the functionality.
Building the Dashboard UI with Gradio
To begin, let's take a look at how we defined the Dashboard's (UI) using only Python. Recall that the UI is composed of all Gradio components defined within the with gr.Blocks() as demo: block. If you are not interested in the UI definition and want to jump straight to implementing the functionality, go to the Adding Functionality to the Dashboard section.
Let's get started!
Introductory HTML and API Key
First, we use some gr.HTML() components to construct the introductory blocks on the Dashboard, seen below. gr.HTML() allows us to define arbitrary HTML elements on the Dashboard. While the specifics of the HTML displayed on the Dashboard are outside the purview of this tutorial, the relevant code can be found on GitHub here for interested readers.
Next, we create the entry field for the API key, shown here:

We create a gr.Box(), box to contain the elements defined in the block underneath it. gr.Box() works similarly to the gr.Row(), which we used in the Gradio Blocks - Finer Control section. Within the Box we put (1) a gr.HTML() component to be used as a label, and (2) a gr.Textbox() into which the API key will be entered:
import gradio as gr

with gr.Blocks(css=css) as demo:
    with gr.Box():
        gr.HTML("<p class=\"apikey\">API Key:</p>")
        # API key textbox (password-style)
        api_key = gr.Textbox(label="", elem_id="pw")
By specifying elem_id=pw in the api_key constructor, we give this component an HTML ID that we can use to style it with CSS as below:
#pw {
  -webkit-text-security: disc;
}
This CSS makes the characters entered into api_key redacted as an extra layer of security for your API Key

This styling is also the reason we specify label="" in the api_key constructor and instead label the Textbox with a distinct HTML element - otherwise the label would also be redacted.

The CSS is stored in app/styles.css and is passed into the application using
with open('styles.css', 'r') as f:
    css = f.read()

with gr.Blocks(css=css) as demo:
	# ...
Gradio States
Next, we define several gr.State() components. These components are state variables and store values for a given user's instance. Any Python variable defined outside a function call is shared between all users, whereas variables defined with gr.State() are accessible only to the session in which they are defined. See the Gradio quickstart for more information.
We add a State that stores the displayed audio plot and States to hold the data for uploaded by each audio source (file or microphone) so that switching between the options in the UI displays the appropriate data for the given source.
with gr.Blocks(css=css) as demo:
	# ...

	# Gradio states for - plotly Figure object, audio data for file source, and audio data for mic source
    plot = gr.State(px.line(labels={'x':'Time (s)', 'y':''}))
    file_data = gr.State([1, [0]])  # [sample rate, [data]]
    mic_data = gr.State([1, [0]])  # [Sample rate, [data]]

    # Options that the user wants
    selected_tran_opts = gr.State(list(transcription_options_headers.keys()))
    selected_audint_opts = gr.State(list(audio_intelligence_headers.keys()))

    # Current options = selected options - unavailable options for specified language
    current_tran_opts = gr.State([])
    current_audint_opts = gr.State([])
Then we define States which store the analysis options a user selects, and the current analysis options, which is the set difference between the selected options and those which are unavailable for the selected language (if specified). In other words, if a user is transcribing a French audio file and would like to run PII Redaction on it, which is not available for French, then these States will allow us to prohibit this choice for French, but automatically enable it if the selected language is changed to e.g. US English, for which PII Redaction is available.
with gr.Blocks(css=css) as demo:
	# ...

	# Gradio states for - plotly Figure object, audio data for file source, and audio data for mic source
    plot = gr.State(px.line(labels={'x':'Time (s)', 'y':''}))
    file_data = gr.State([1, [0]])  # [sample rate, [data]]
    mic_data = gr.State([1, [0]])  # [Sample rate, [data]]

    # Options that the user wants
    selected_tran_opts = gr.State(list(transcription_options_headers.keys()))
    selected_audint_opts = gr.State(list(audio_intelligence_headers.keys()))

    # Current options = selected options - unavailable options for specified language
    current_tran_opts = gr.State([])
    current_audint_opts = gr.State([])
For a list of supported languages and the Transcription and Audio Intelligence options that are available to each, check out the AssemblyAI documentation.
Audio Components
Next, we define the gr.Audio() components that are used to upload audio.
We add a gr.Radio() component that houses options of which exactly one can/must be selected. We provide the possible values in a list and then add a label and the default value.
with gr.Blocks(css=css) as demo:
    # ...

    # Selector for audio source
    radio = gr.Radio(["Audio File", "Record Audio"], label="Audio Source", value="Audio File")
Next, we add two gr.Audio() components, which are used to upload/record audio. We add one component for file upload and one for audio recording. We specify that the source for the recording component is a microphone by adding source="microphone" to the constructor, and we also specify that the component should not be visible by default with visible=False. Later, we will use the Radio component above to change which component is visible.
with gr.Blocks(css=css) as demo:
    # ...

    # Audio object for both file and microphone data
    audio_file = gr.Audio()
    mic_recording = gr.Audio(source="microphone", visible=False)
Finally, we add a plot in order to display the waveform of the uploaded/recorded audio.
with gr.Blocks(css=css) as demo:
    # ...

    # Audio wave plot
    audio_wave = gr.Plot(plot.value)
Transcription and Audio Intelligence Options
Next we add two gr.CheckboxGroup() components, which provide a group of checkboxes, any combination of which can be (de)selected.
We add one CheckboxGroup for the transcription options, and one for the Audio Intelligence options, with a warning in between (that has been replaced with "<WARNING>" for brevity).
with gr.Blocks(css=css) as demo:
	# ...

    # Checkbox for transcription options
    transcription_options = gr.CheckboxGroup(
        choices=list(transcription_options_headers.keys()),
        value=list(transcription_options_headers.keys()),
        label="Transcription Options",
    )

    # Warning for using Automatic Language detection
    w = "<WARNING>"
    auto_lang_detect_warning = gr.HTML(w)

    # Checkbox for Audio Intelligence options
    audio_intelligence_selector = gr.CheckboxGroup(
        choices=list(audio_intelligence_headers.keys()),
        value=list(audio_intelligence_headers.keys()),
        label='Audio Intelligence Options'
    )
In each case, we specify the possible choices as the keys of the relevant dictionaries imported from helpers.py, and we list the value as the same to have all options selected by default.
Submit and Example Buttons
Next we add the Submit and Show Example Output buttons.

Each button is a gr.Button() component, where the text passed into the constructor is displayed on the button in the UI.
with gr.Blocks(css=css) as demo:
    # ...

    # Button to submit audio for processing with selected options
    submit = gr.Button('Submit')

    # Button to submit audio for processing with selected options
    example = gr.Button('Show Example Output')
Results Tabs
Finally, we add the tabs used to display the results.
Each tab is created with with gr.Tab():, where anything defined within the block becomes a child of the Tab. In our case, we specify several different types of components, mostly relying on gr.HTML() for the flexibility it will afford us in displaying the results. The only component used that we have not seen yet is the gr.HighlightedText() component, which is similar to gr.Textbox() except it affords options to highlight portions of the text. We use the phl variable to make each Tab a similar height by default.
with gr.Blocks(css=css) as demo:
    # ...

    # Results tab group
    phl = 10
    with gr.Tab('Transcript'):
        trans_tab = gr.Textbox(placeholder="Your formatted transcript will appear here ...",
                               lines=phl,
                               max_lines=25,
                               show_label=False)
    with gr.Tab('Speaker Labels'):
        diarization_tab = gr.Textbox(placeholder="Your diarized transcript will appear here ...",
                                     lines=phl,
                                     max_lines=25,
                                     show_label=False)
    with gr.Tab('Auto Highlights'):
        highlights_tab = gr.HighlightedText()
    with gr.Tab('Summary'):
        summary_tab = gr.HTML("<br>"*phl)
    with gr.Tab("Detected Topics"):
        topics_tab = gr.HTML("<br>"*phl)
    with gr.Tab("Sentiment Analysis"):
        sentiment_tab = gr.HTML("<br>"*phl)
    with gr.Tab("Entity Detection"):
        entity_tab = gr.HTML("<br>"*phl)
    with gr.Tab("Content Safety"):
        content_tab = gr.Plot()
That's all it takes to construct the UI with Gradio! Now that we're done making the UI, let's see how we add in functionality to make it a fully-fledged Audio Intelligence Dashboard.
Adding Functionality to the Dashboard
Let's take a look at how to add functionality to the UI we defined in the section above. All functionality is similarly defined under the main with gr.Blocks(css=css) as demo: block, as is required when working with Gradio Blocks style as demonstrated in the Gradio Blocks section above.
Audio Source Selection
First, we'll implement the proper functionality for when the audio source selector (i.e. radio) is changed. This functionality is implemented via the change_audio_source() function, which updates the plot with the appropriate data stored in a Session State according to the radio source selection. The inputs, outputs, and overview of this function are depicted in the diagram below.
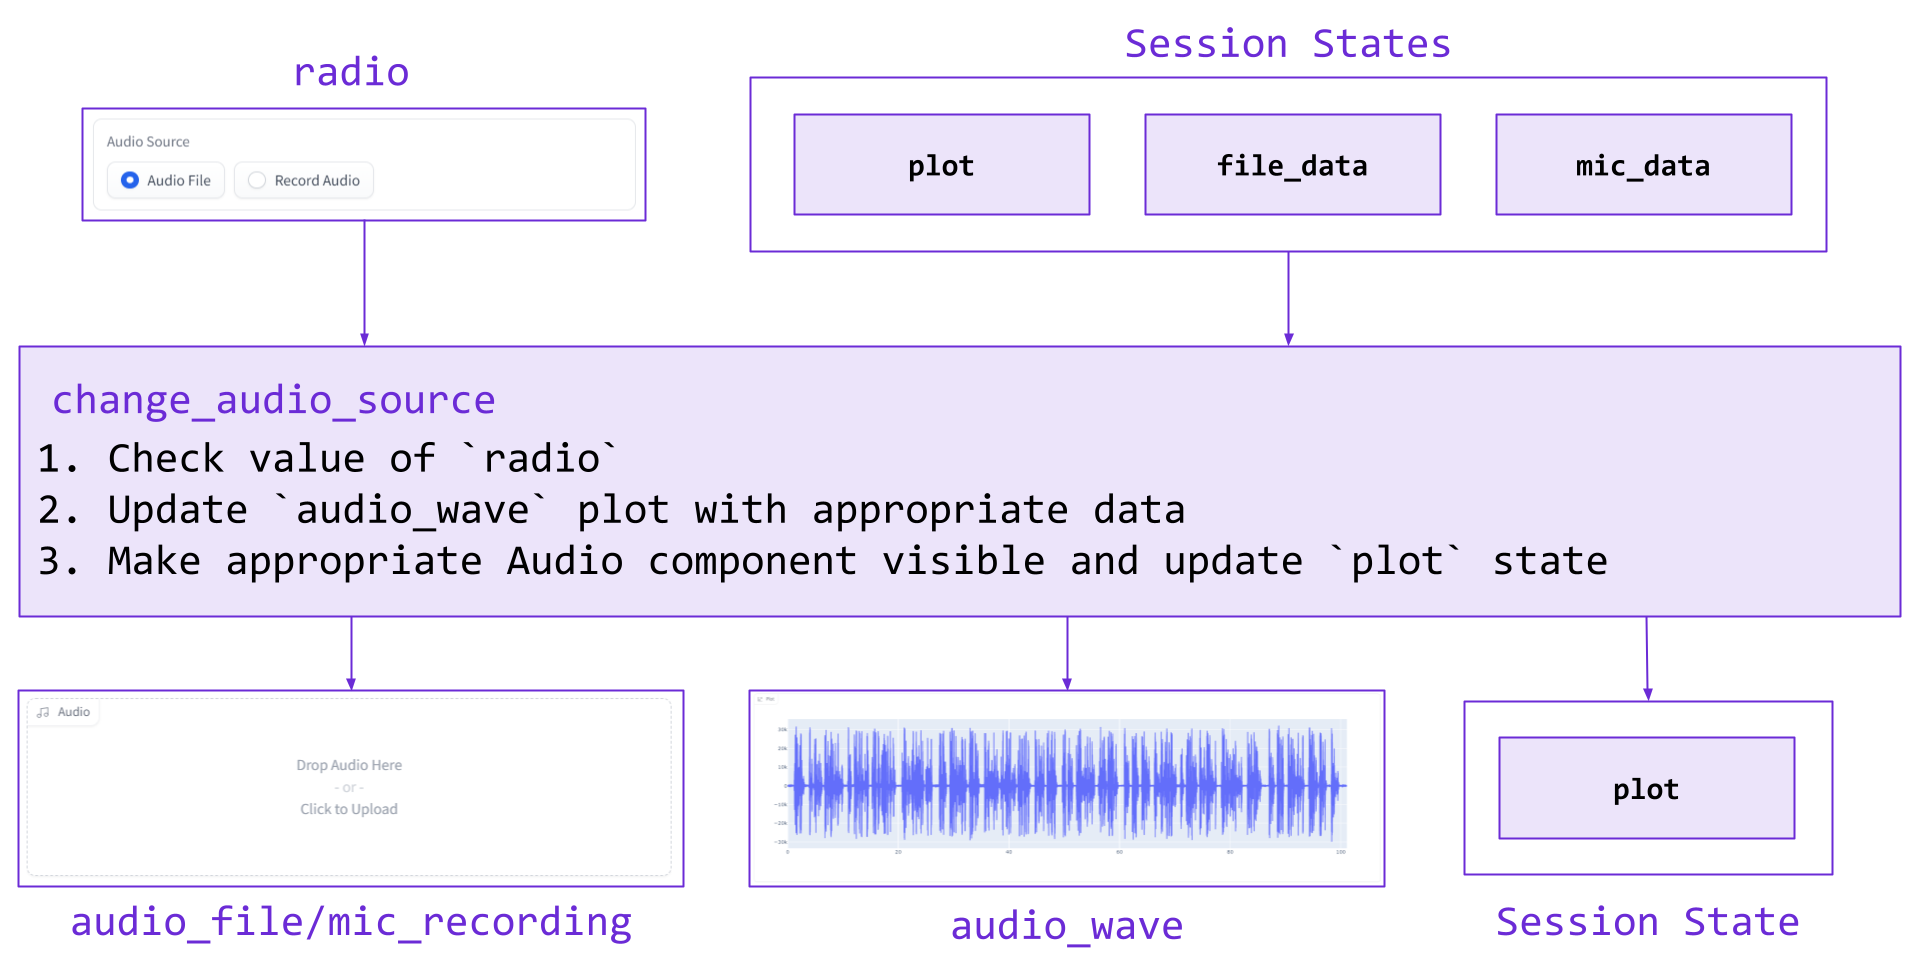
The corresponding code can be seen below:
def change_audio_source(radio, plot, file_data, mic_data):
    # Empty plot
    plot.update_traces(go.Line(y=[]))

    # Update plot with appropriate data and change visibility of audio components
    if radio == "Audio File":
        sample_rate, audio_data = file_data
        plot.update_traces(go.Line(y=audio_data, x=np.arange(len(audio_data)) / sample_rate))
        return [gr.Audio.update(visible=True), gr.Audio.update(visible=False),
                gr.Plot.update(plot), plot]

    elif radio == "Record Audio":
        sample_rate, audio_data = mic_data
        plot.update_traces(go.Line(y=audio_data, x=np.arange(len(audio_data)) / sample_rate))
        return [gr.Audio.update(visible=False), gr.Audio.update(visible=True),
                gr.Plot.update(plot), plot]

with gr.Blocks(css=css) as demo:
    # ...

    radio.change(fn=change_audio_source,
                 inputs=[radio, plot, file_data, mic_data],
                 outputs=[audio_file, mic_recording, audio_wave, plot])
Audio File Upload
Next, we implement the functionality to plot and save uploaded audio data, which uses the plot_data() function. If the current audio has been deleted, we empty the plot and write placeholder data to the file_data State. Otherwise, new audio has been uploaded and we plot it and save the data to file_data. The inputs, outputs, and overview of this function are depicted in the diagram below.
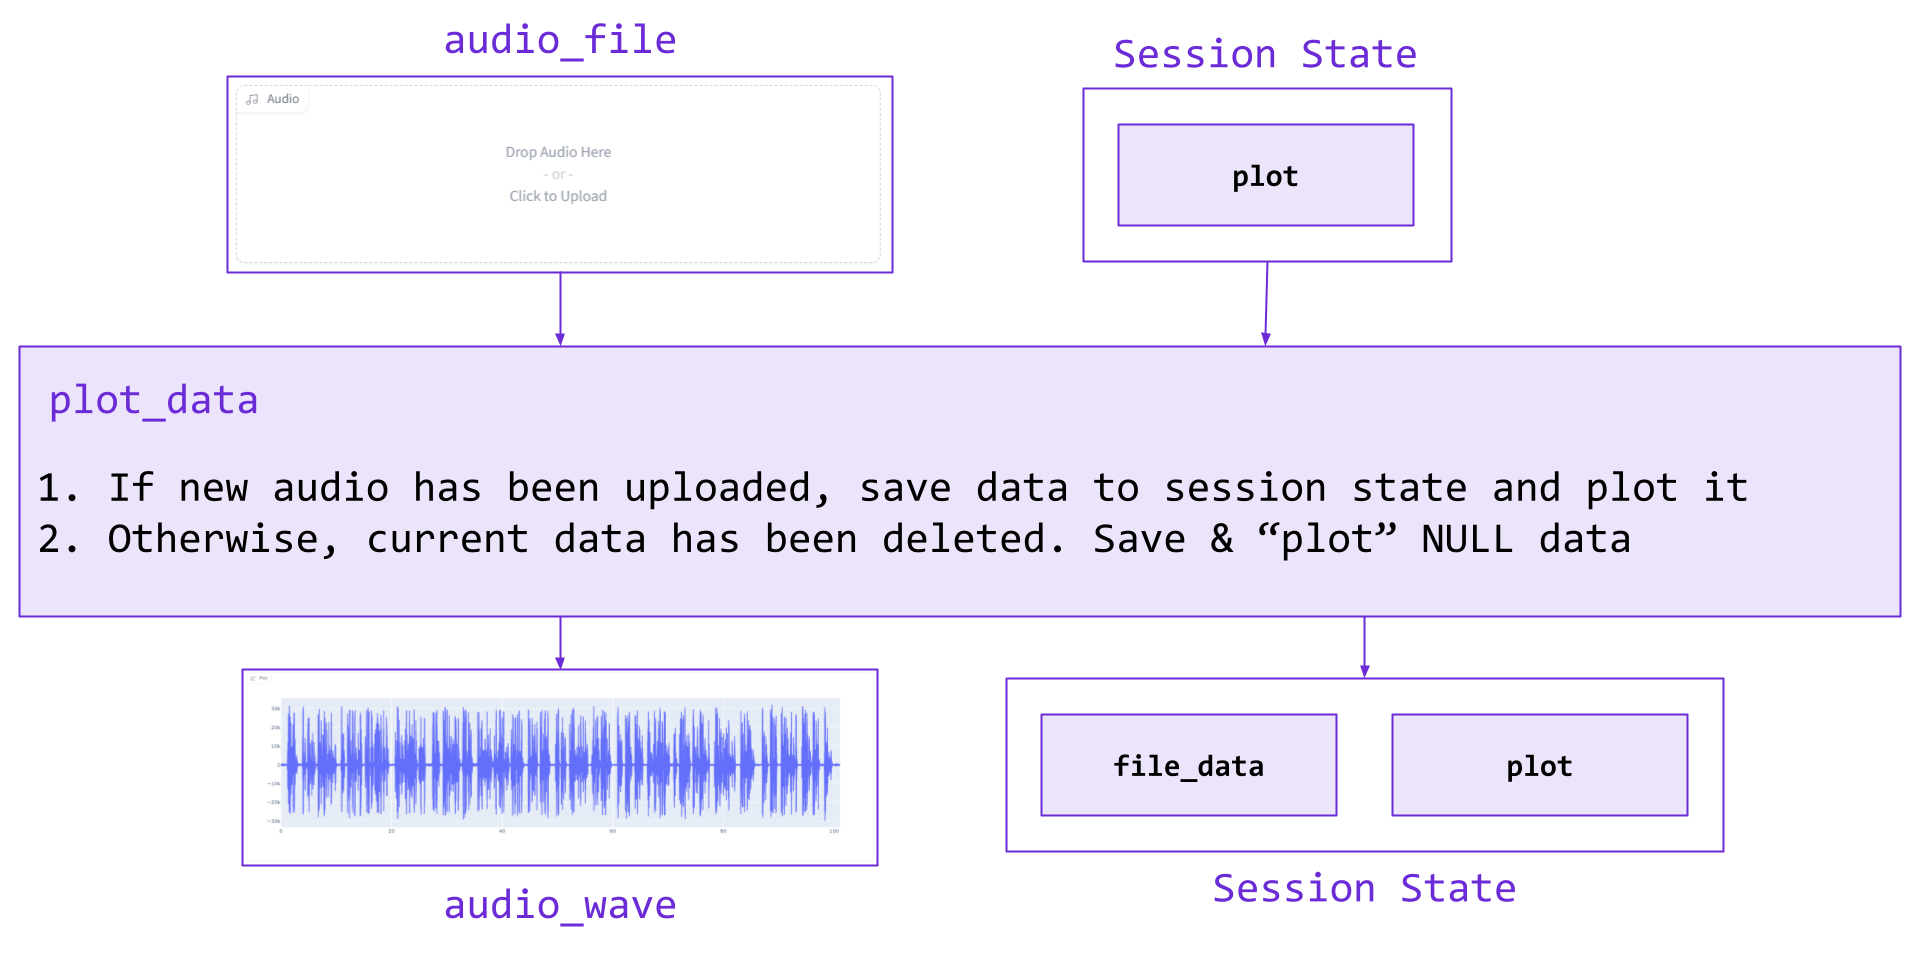
A similar setup is used to add the equivalent functionality for a microphone recording rather than an uploaded file. The corresponding code can be seen below:
def plot_data(audio_data, plot):

    if audio_data is None:
        sample_rate, audio_data = [0, np.array([])]
        plot.update_traces(go.Line(y=[]))

    else:
        sample_rate, audio_data = audio_data
        plot.update_traces(go.Line(y=audio_data, x=np.arange(len(audio_data))/sample_rate))

    return [gr.Plot.update(plot), [sample_rate, audio_data], plot]

with gr.Blocks(css=css) as demo:
    # ...

    audio_file.change(fn=plot_data,
                      inputs=[audio_file, plot],
                      outputs=[audio_wave, file_data, plot]
                      )
    mic_recording.change(fn=plot_data,
                         inputs=[mic_recording, plot],
                         outputs=[audio_wave, mic_data, plot])
Language Visibility
Next, we implement the proper functionality for when transcription_options is changed, which uses the set_lang_vis function. Whenever the transcription_options CheckboxGroup changes, the language dropdown is made visible if Automatic Language Detection is not selected, and made invisible if it is. Additionally, a warning is made visible/invisible accordingly. The inputs, outputs, and overview of this function are depicted in the diagram below.
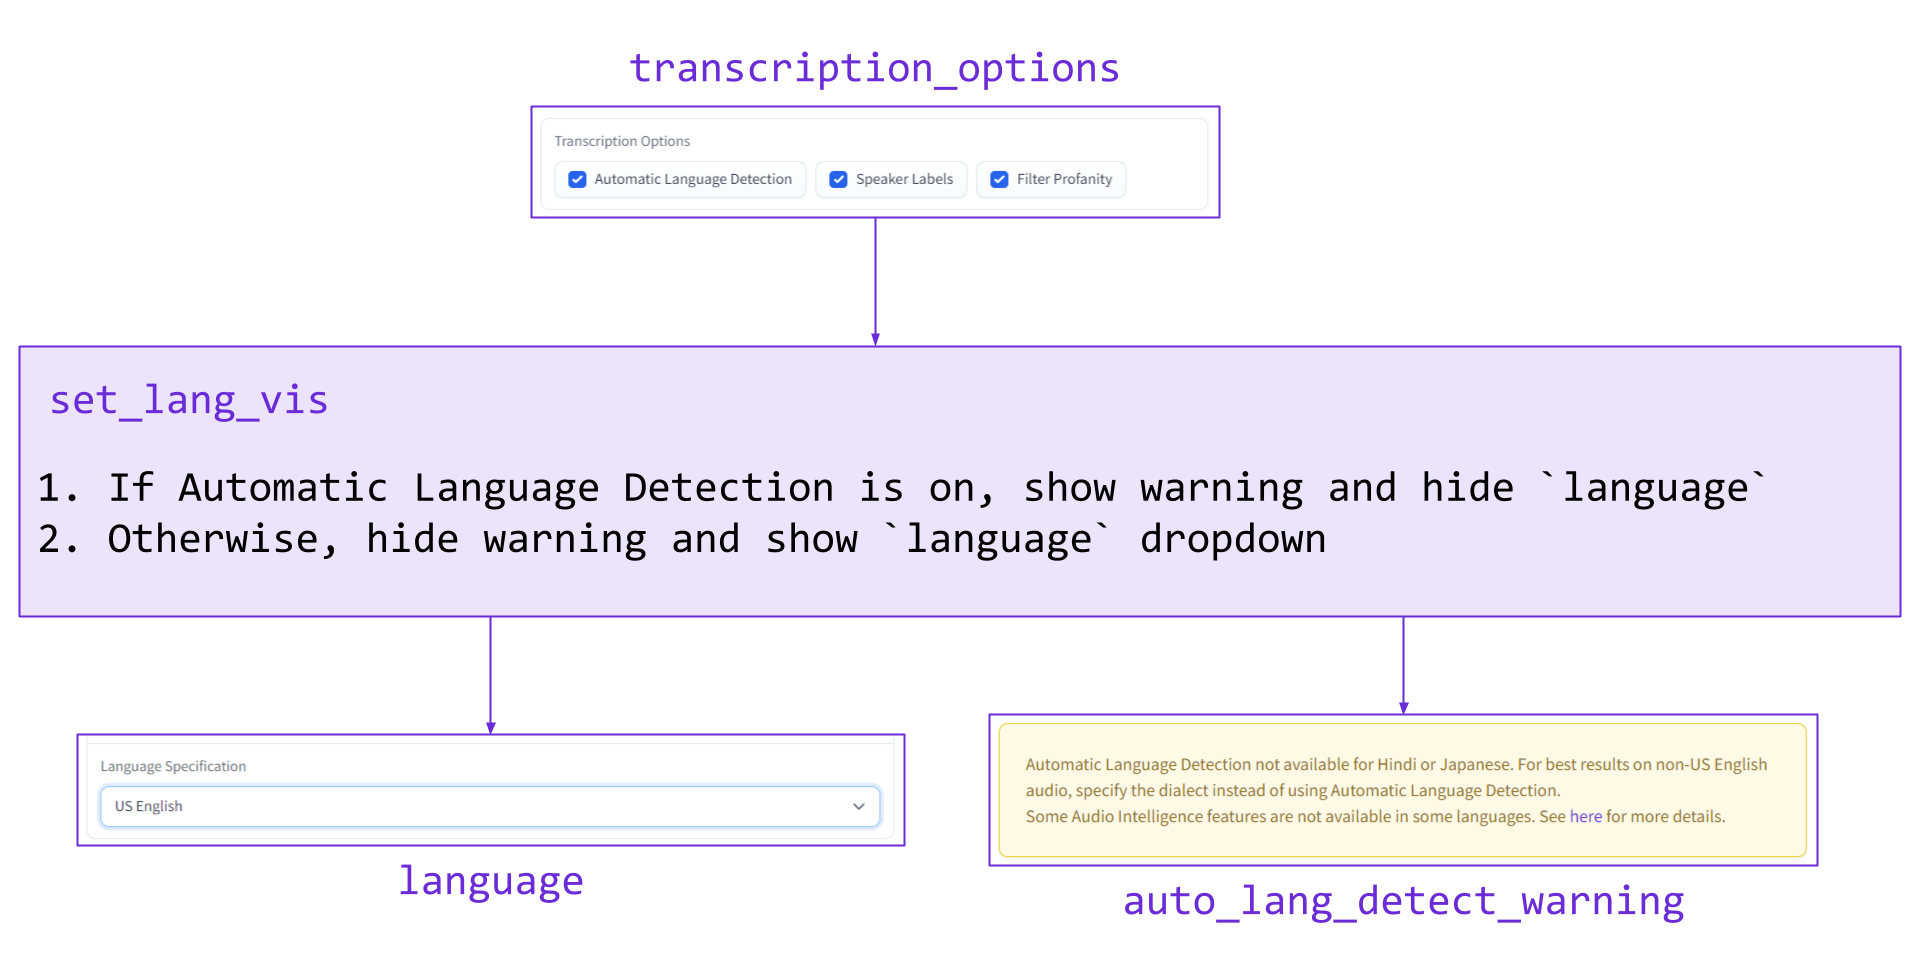
The corresponding code can be seen below, where w is a global variable:
def set_lang_vis(transcription_options):
    if 'Automatic Language Detection' in transcription_options:
        text = w
        return [gr.Dropdown.update(visible=False),
                gr.Textbox.update(value=text, visible=True)]
    else:
        text = ""
        return [gr.Dropdown.update(visible=True),
                gr.Textbox.update(value=text, visible=False)]

with gr.Blocks(css=css) as demo:
	# ...

    transcription_options.change(
        fn=set_lang_vis,
        inputs=transcription_options,
        outputs=[language, auto_lang_detect_warning])
Option Verification
Next, we implement the proper functionality for when the selected language is changed, which uses the option_verif function. When a language is selected, any currently selected transcription / audio intelligence options that are unavailable for that language are automatically removed. Additionally, any previously selected options that were not available in the previous language but are available in the newly selected one are added back. The inputs, outputs, and overview of this function are depicted in the diagram below.
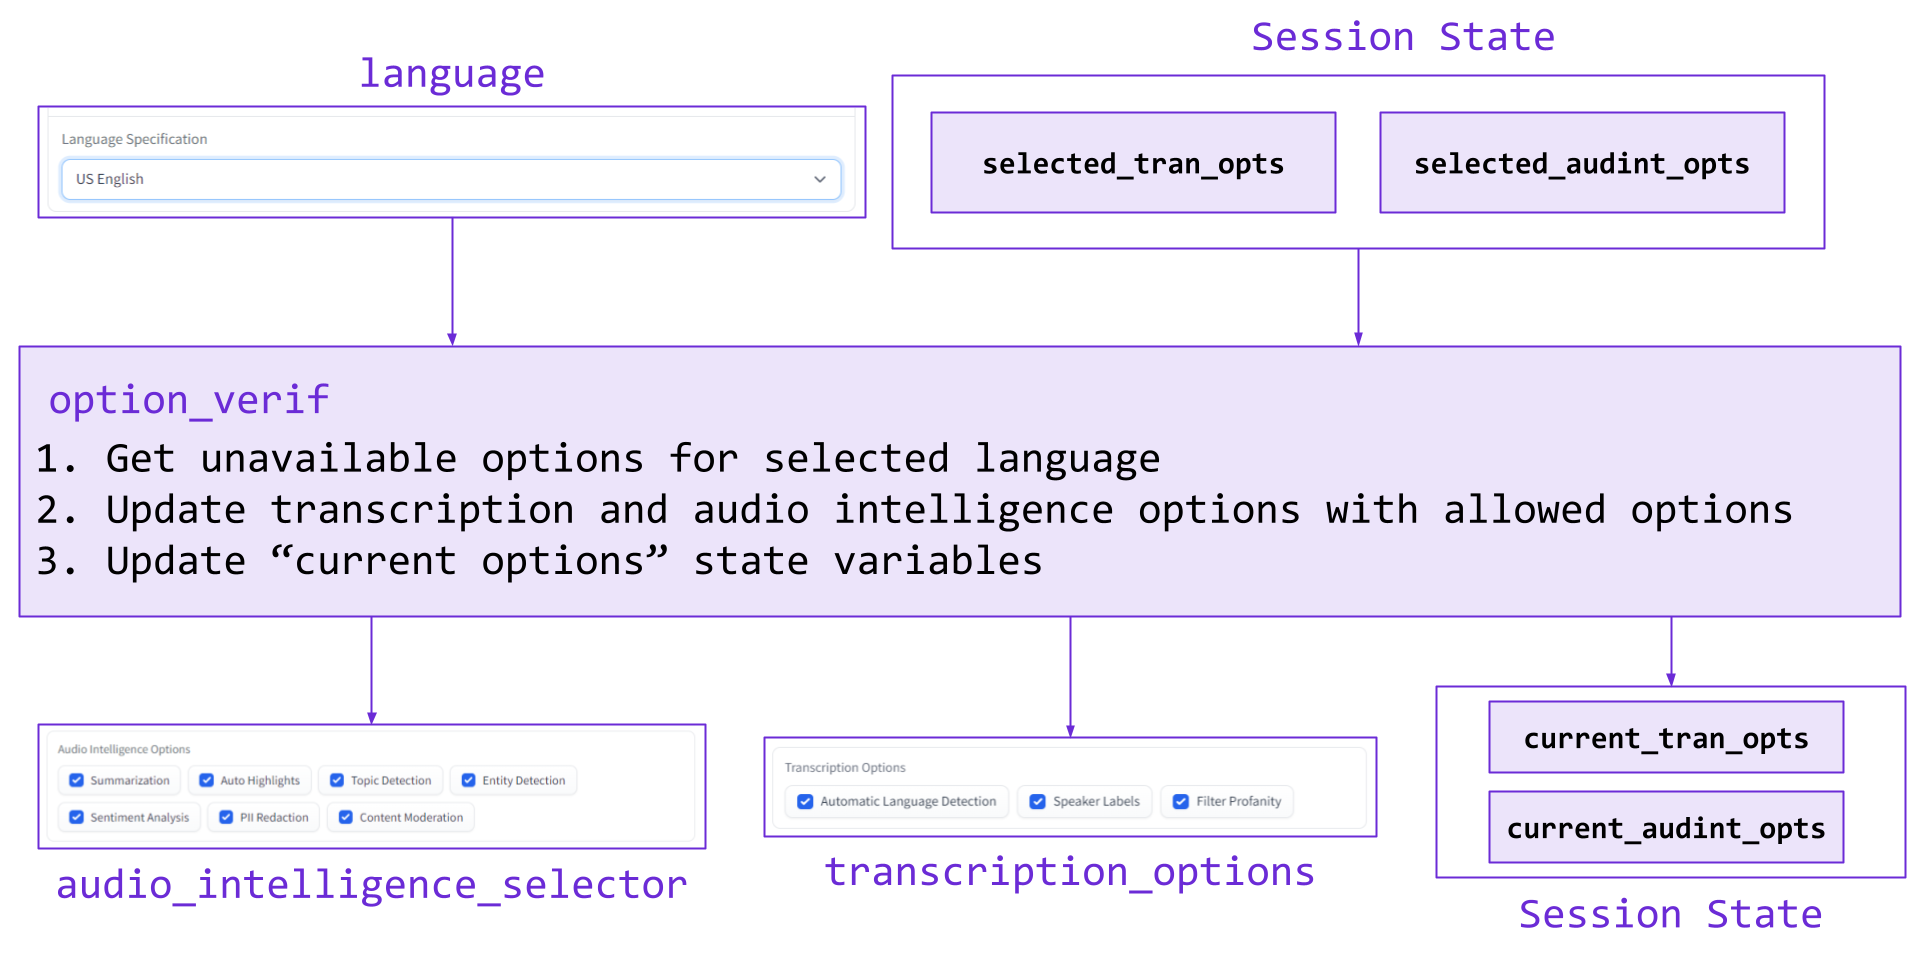
The corresponding code can be seen below:
def option_verif(language, selected_tran_opts, selected_audint_opts):
	# Get unavailable options for the language
    not_available_tran, not_available_audint = get_unavailable_opts(language)

    # Set difference
    current_tran_opts = list(set(selected_tran_opts) - set(not_available_tran))
    current_audint_opts = list(set(selected_audint_opts) - set(not_available_audint))

    # Update CheckboxGroups and States
    return [gr.CheckboxGroup.update(current_tran_opts),
            gr.CheckboxGroup.update(current_audint_opts),
            current_tran_opts,
            current_audint_opts]

with gr.Blocks(css=css) as demo:
	# ...

	language.change(
        fn=option_verif,
        inputs=[language, selected_tran_opts, selected_audint_opts],
        outputs=[transcription_options, audio_intelligence_selector, current_tran_opts, current_audint_opts]
    )
Option Selection
Next, we implement a filter for when the transcription_options CheckboxGroup is changed, i.e. when an option is selected or deselected. In our case, some transcriptions options are not allowed with certain languages, so we need use tran_selected to implement a filter to account for this.
The language and transcription options are passed in, and then the unavailable options for a given language are determined. The set difference between the transcription options and unavailable options is calculated, which becomes the value for both the transcription_options CheckboxGroup and the selected_tran_opts State. The inputs, outputs, and overview of this function are depicted in the diagram below.
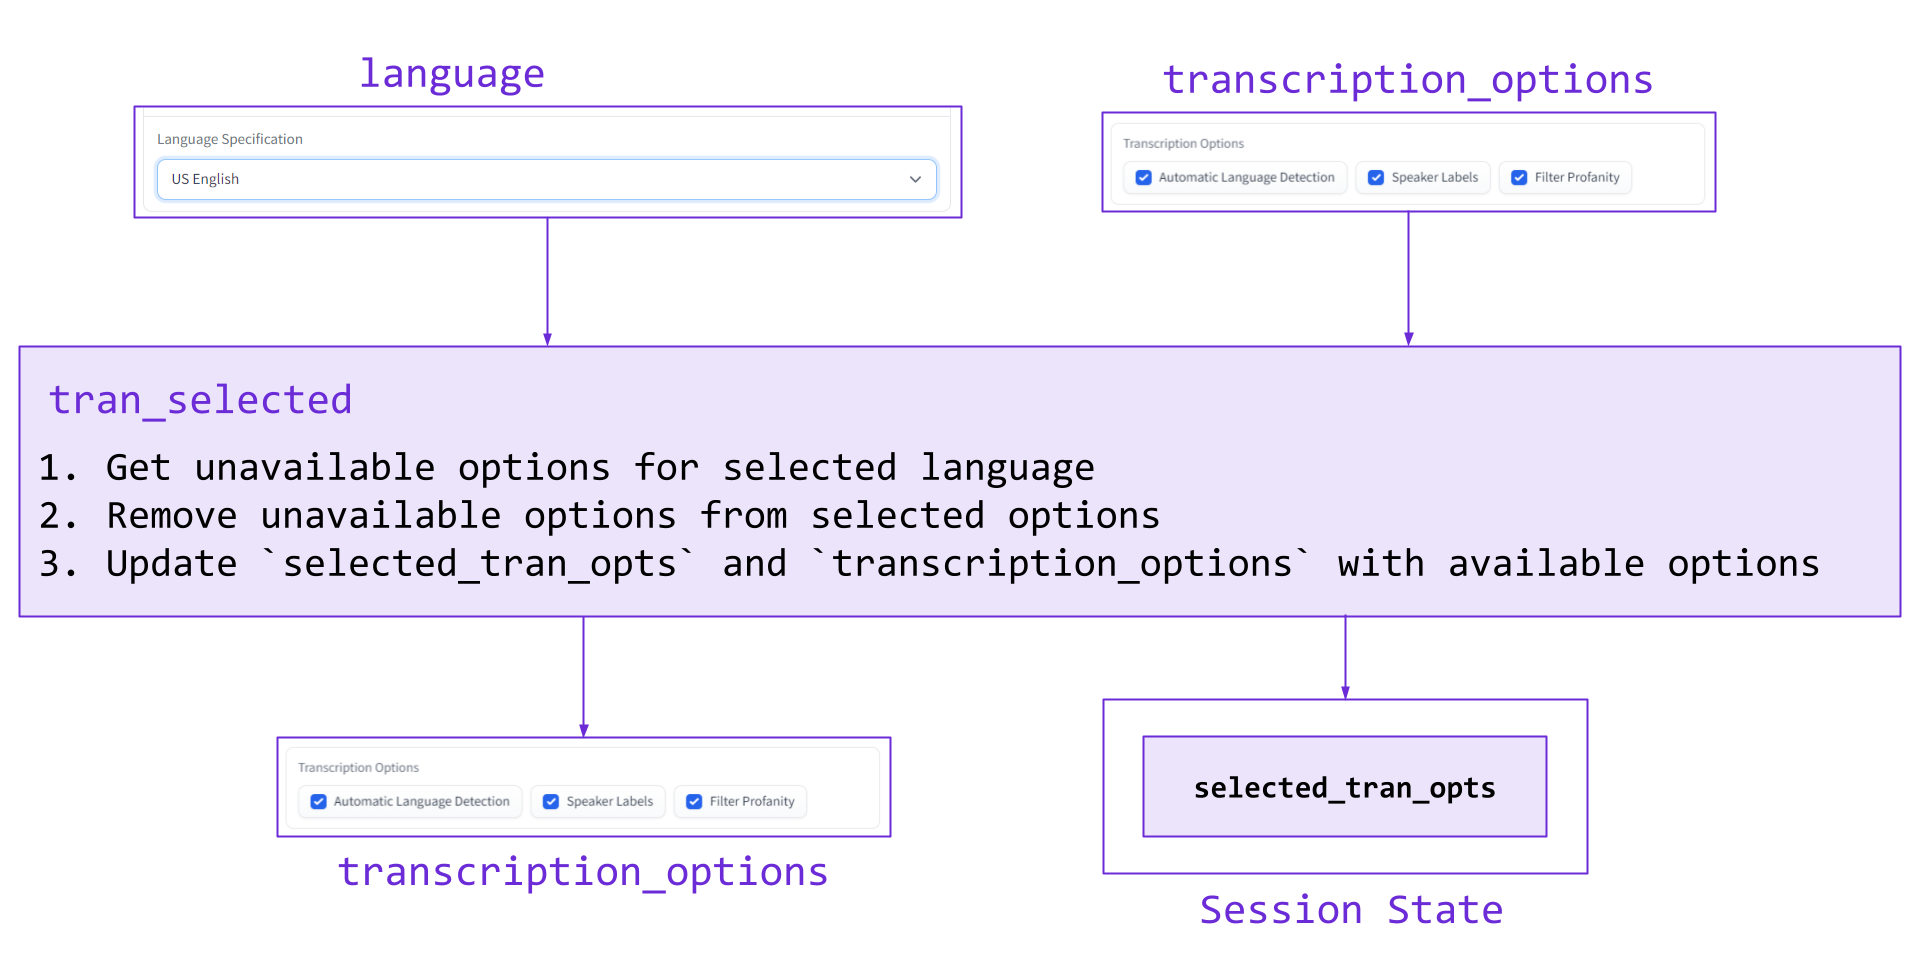
The corresponding code can be seen below:
def tran_selected(language, transcription_options):
    unavailable, _ = get_unavailable_opts(language)
    selected_tran_opts = list(set(transcription_options) - set(unavailable))

    return [gr.CheckboxGroup.update(selected_tran_opts), selected_tran_opts]

with gr.Blocks(css=css) as demo:
	# ...

	# Selecting Tran options adds it to selected if language allows it
    transcription_options.change(
        fn=tran_selected,
        inputs=[language, transcription_options],
        outputs=[transcription_options, selected_tran_opts]
    )
Note that in Language Visibility section we already utilized transcription_options.change(). With Gradio, it is possible to implement multiple event listeners for the same event.
We implement the equivalent functions for the Audio Intelligence CheckboxGroup:
def audint_selected(language, audio_intelligence_selector):
    _, unavailable = get_unavailable_opts(language)
    selected_audint_opts = list(set(audio_intelligence_selector) - set(unavailable))

    return [gr.CheckboxGroup.update(selected_audint_opts), selected_audint_opts]

with gr.Blocks(css=css) as demo:
	# ...

    # Selecting audio intelligence options adds it to selected if language allows it
    audio_intelligence_selector.change(
        fn=audint_selected,
        inputs=[language, audio_intelligence_selector],
        outputs=[audio_intelligence_selector, selected_audint_opts]
    )
Submit and Example Output
Finally, we implement the functionality for the Submit and Show Example Output buttons.
with gr.Blocks(css=css) as demo:
	# ...

	submit.click(fn=submit_to_AAI,
                 inputs=[api_key,
                         transcription_options,
                         audio_intelligence_selector,
                         language,
                         radio,
                         audio_file,
                         mic_recording],
                 outputs=[language,
                          trans_tab,
                          diarization_tab,
                          highlights_tab,
                          summary_tab,
                          topics_tab,
                          sentiment_tab,
                          entity_tab,
                          content_tab])
Let's take a look at each part of submit_to_AAI in turn. Many of the below steps are explained in more details in the AssemblyAI and Python in 5 Minutes article, so interested readers can check out that article for additional information.
First, we create an HTTP header that stores the user's API key. This header will be used in all API requests and lets the AssemblyAI API know that the user is authorized to request transcriptions and access the results. The make_header() function can be found in helpers.py.
def submit_to_AAI(api_key,
                  transcription_options,
                  audio_intelligence_selector,
                  language,
                  radio,
                  audio_file,
                  mic_recording):

    # Make request header
    header = make_header(api_key)
Next, we create our the JSON used in the request. The make_true_dict() function maps the selected options from the Dashboard onto the appropriate keys for the AssemblyAI API. Next, we use the make_final_json function to add any remaining required data to the JSON. For example, redact_pii requires a specification of which types of PII to redact, and this function adds the redact_pii_policies key with the value ['drug', 'injury', 'person_name', 'money_amount'].
def submit_to_AAI(api_key,
                  transcription_options,
                  audio_intelligence_selector,
                  language,
                  radio,
                  audio_file,
                  mic_recording):

    # ...

    # Map transcription/audio intelligence options to AssemblyAI API request JSON dict
    true_dict = make_true_dict(transcription_options, audio_intelligence_selector)

    final_json, language = make_final_json(true_dict, language)
    final_json = {**true_dict, **final_json}
Next, we upload the audio stored in the State of whichever source is selected at the time of submission, and then we request a transcription and audio intelligence analysis for that audio according to the choices we made on the dashboard (now encoded in final_json).
def submit_to_AAI(api_key,
                  transcription_options,
                  audio_intelligence_selector,
                  language,
                  radio,
                  audio_file,
                  mic_recording):

    # ...

    # Select which audio to use
    if radio == "Audio File":
        audio_data = audio_file
    elif radio == "Record Audio":
        audio_data = mic_recording

    # Upload the audio
    upload_url = upload_file(audio_data, header, is_file=False)

    # Request transcript
    transcript_response = request_transcript(upload_url, header, **final_json)
We then create a polling endpoint, which will allow us to tell when the transcription is complete with the wait_for_completion() function. After the transcription is finished, we use a GET request to fetch the results.
def submit_to_AAI(api_key,
                  transcription_options,
                  audio_intelligence_selector,
                  language,
                  radio,
                  audio_file,
                  mic_recording):

    # ...

    # Wait for the transcription to complete
    polling_endpoint = make_polling_endpoint(transcript_response)
    wait_for_completion(polling_endpoint, header)

    # Fetch results JSON
    r = requests.get(polling_endpoint, headers=header, json=final_json).json()
Finally, we pass the resulting response (and results from make_paras_string()) through the create_output() function, which prepares everything for display in the Dashboard. The details of create_output() are examined below.
def submit_to_AAI(api_key,
                  transcription_options,
                  audio_intelligence_selector,
                  language,
                  radio,
                  audio_file,
                  mic_recording):

    # ...

    # Fetch paragraphs of transcript
    transc_id = r['id']
    paras = make_paras_string(transc_id, header)
    return create_output(r, paras, language, transcription_options, audio_intelligence_selector)
The Show Example Output button loads a stored AssemblyAI API response and instead passes this into create_output().
def example_output(language):
    """Displays example output"""
    with open("../example_data/paras.txt", 'r') as f:
        paras = f.read()

    with open('../example_data/response.json', 'r') as f:
        r = json.load(f)

    return create_output(r, paras, language)

with gr.Blocks(css=css) as demo:
	# ...

	example.click(fn=example_output,
                  inputs=language,
                  outputs=[language,
                           trans_tab,
                           diarization_tab,
                           highlights_tab,
                           summary_tab,
                           topics_tab,
                           sentiment_tab,
                           entity_tab,
                           content_tab])
Create Output
As mentioned above, oth the Submit and Show Example Output buttons pass a response from the AssemblyAI API to the create_output() function, which processing the information in the response for display in the Gradio Dashboard. This function is effectively a series of distinct components, each of which prepares the output for one of the Tab objects in the Dashboard.
In the below subsections, we will examine each of these components, examining the code itself or a conceptual overview depending on which is more instructive for the given component. Examples of all outputs can be found in the Examining the Results section above.
Transcript
The raw transcript is created with make_paras_string() in helpers.py. The function first makes a request to the AssemblyAI API's /paragraphs endpoint to get a list of paragraph objects, and then the text from these objects is isolated and concatenated with newline characters in between.
def make_paras_string(transc_id, header):
    endpoint = transcript_endpoint + "/" + transc_id + "/paragraphs"
    paras = requests.get(endpoint, headers=header).json()['paragraphs']
    paras = '\n\n'.join(i['text'] for i in paras)
    return paras
You can check out an example output in the Transcript section above.
Speaker Labels
The JSON from the original response from the AssemblyAI API's v2/transcript endpoint contains the utterances key, whose value is a sequential list of utterances throughout the audio, as seen below:
"utterances": [
    {
      "confidence": 0.9550143322475569,
      "end": 99430,
      "speaker": "A",
      "start": 1150,
      "text": "You will never believe what happened to me last week. My SUV broke ... to get it replaced. What are you doing this weekend?",
      "words": [...]
    }
  ],
We use list comprehension to add the speaker label to the text of each utterance, and then concatenate the list elements together with newline characters in between, as above.
utts = '\n\n\n'.join([f"Speaker {utt['speaker']}:\n\n" + utt['text'] for utt in r['utterances']])This calculation happens in the create_output() function itself, and therefore does not rely on any functions from helpers.py. An example speaker labels output can be found in the Speaker Labels section above.
Auto Highlights
The auto highlights information in the AssemblyAI response has the below form, where results is a list of dictionaries, each containing information about a given highlight
"auto_highlights_result": {
    "status": "success",
    "results": [
      {
        "count": 1,
        "rank": 0.09,
        "text": "good professors",
        "timestamps": [
          {
            "start": 58964,
            "end": 60030
          }
        ]
      },
      {"count": 1...},
      {"count": 1...},
      ...
      {"count": 1...},
    ]
  },
To process this information for display on the Dashboard, we use the create_highlighted_list() function in helpers.py. First, low rank highlight objects are potentially filtered out, and then values are calculated which will allow us to scale the highlight opacities according to rank later on
def create_highlighted_list(paragraphs_string, highlights_result, rank=0):
    # Max and min opacities to highlight to
    MAX_HIGHLIGHT = 1  # Max allowed = 1
    MIN_HIGHLIGHT = 0.25  # Min allowed = 0

    # Filter list for everything above the input rank
    highlights_result = [i for i in highlights_result if i['rank'] >= rank]

    # Get max/min ranks and find scale/shift we'll need so ranks are mapped to [MIN_HIGHLIGHT, MAX_HIGHLIGHT]
    max_rank = max([i['rank'] for i in highlights_result])
    min_rank = min([i['rank'] for i in highlights_result])
    scale = (MAX_HIGHLIGHT - MIN_HIGHLIGHT) / (max_rank - min_rank)
    shift = (MAX_HIGHLIGHT - max_rank * scale)
Next, RegEx is used to find each instance of each highlight object phrase, and then a list is created with list comprehension that prepares the data with the appropriate formatting to be input into gr.HighlightedText().
The "entity" value, in this case, is a float in the range [0, 1] that corresponds to the entity's highlight opacity. We use a scale-shift to bring the value between MIN_HIGHLIGHT and MAX_HIGHLIGHT for each entity, proportional to its rank. The "start" and "end" values denote the start and end characters for the highlighted text in the entire text body, which is paragraphs_string in this case.
def create_highlighted_list(paragraphs_string, highlights_result, rank=0):
    # ...

    # Isolate only highlight text and rank
    highlights_result = [(i['text'], i['rank']) for i in highlights_result]

    entities = []
    for highlight, rank in highlights_result:
        # For each highlight, find all starting character instances
        starts = [c.start() for c in re.finditer(highlight, paragraphs_string)]
        # Create list of locations for this highlight with entity value (highlight opacity) scaled properly
        e = [{"entity": rank * scale + shift,
              "start": start,
              "end": start + len(highlight)}
             for start in starts]
        entities += e
Finally, the output dictionary is created, which provides the necessary input structure to gr.HighlightedText. We sort the entities by starting character value to avoid a bug in Gradio 3.2 which incorrectly displays the text if this is not done, and then return the output dictionary.
def create_highlighted_list(paragraphs_string, highlights_result, rank=0):
    # ...

    # Create dictionary
    highlight_dict = {"text": paragraphs_string, "entities": entities}

    # Sort entities by start char. A bug in Gradio requires this
    highlight_dict['entities'] = sorted(highlight_dict['entities'], key=lambda x: x['start'])

    return highlight_dict
An example auto highlights output can be found in the Auto Highlights section.
Summary
The summary information in the AssemblyAI response JSON has a simple form - for each automatically detected "chapter", a summary, headline, and gist are returned. summary is a full summary of the chapter, headline distills the information further for an even shorter summary, and gist provides the shortest summary with just a few words.
"chapters": [
    {
      "summary": "After his SUV broke down, he had to go to an auto shop to get a new gasket installed. Yesterday ... the program. He's also going to play basketball for his new team while earning his degree.",
      "headline": "Yesterday he was walking in South Boston to pick the car up, and some guy got thrown through the window of a pub.",
      "gist": "What's up jack.",
      "start": 1150,
      "end": 99430
    }
  ],
To format this information properly for our Dashboard, we use the make_summary() function in helpers.py, which simply uses an HTML details tag to display the headline, bolded, with the summary appearing upon clicking the headline text.
An example summary output can be found in the Summary section.
Detected Topics
The topic detection information in the AssemblyAI response JSON has the following form, where we have selected only a subset of detected topics for brevity. For example, the line Sports>CollegeSports>CollegeBasketball implies that the topic CollegeBasketball was detected, which is classified under CollegeSports, which is in turn classified under Sports.
"iab_categories_result": {
  "status": "success",
  "results: [...]
  "summary": {
      "Sports>CollegeSports>CollegeBasketball": 0.9752611517906189,
      "Sports>Basketball": 0.9687691926956177,
      "Automotive>AutoSafety": 0.7185451984405518,
      "Education>CollegeEducation>PostgraduateEducation": 0.14552389085292816,
      "Automotive>AutoTechnology>AutoSafetyTechnologies": 0.11995891481637955,
      "Automotive>AutoRecalls": 0.11385084688663483,
      "Education>CollegeEducation>UndergraduateEducation": 0.11231876164674759,
      "Sports>CollegeSports": 0.08391721546649933,
      "Sports>Boxing": 0.06388098001480103,
      "Automotive>AutoType>DriverlessCars": 0.02020467445254326,
    }
  },
To format this information for output to the Dashboard, we use the make_html_from_topics() function in helpers.py. This function is fairly complicated, so we will look at a conceptual overview rather than the code directly, although interested readers are encouraged to click on the function name above to view the source on GitHub.
make_html_from_topics() first isolates just the keys in the summary dictionary, potentially filtering out keys with low values (which correspond to the relevancy of the topic identified by the key to the text). This leaves a list like the following:
['Sports>CollegeSports>CollegeBasketball',
 'Sports>Basketball',
 'Automotive>AutoSafety',
 'Education>CollegeEducation>PostgraduateEducation',
 'Automotive>AutoTechnology>AutoSafetyTechnologies',
 'Automotive>AutoRecalls',
 'Education>CollegeEducation>UndergraduateEducation',
 'Sports>CollegeSports',
 'Sports>Boxing',
 'Automotive>AutoType>DriverlessCars',]
This list is then passed through a function that recursively turns it into a dictionary which represents a tree as below. Each topic that appears in the above list is a node, having as its children any subtopics that appear in the above list. Each node also potentially has a NULL child (represented by an N in a circle in the diagram and by a null key-value pair in the dictionary), which signifies a particular topic is an identified topic. This is important because e.g. CollegeSports itself is identified as a detected topic in addition CollegeBasketball, which is its child.
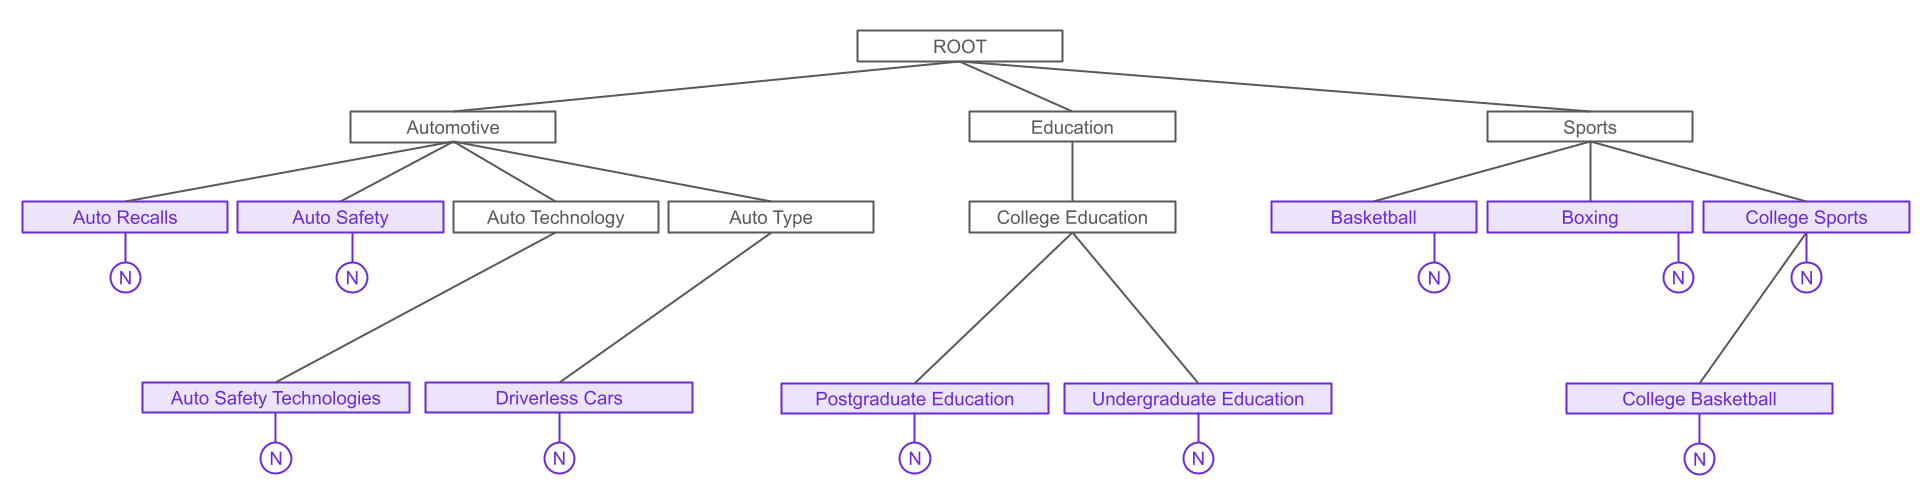
The remainder of make_html_from_topics() traverses the tree, converting it to HTML in which each topic is listed with its subtopics below recursively, giving each "level" of the tree a different class - topic-L0, topic-L1, and so on. All purple nodes (i.e. topics determined to be present in the audio) are also made to be part of another class istopic, which is used to color the associated text in the Dashboard.
The below CSS provides the styling for each of these elements.
.istopic {
color: #6b2bd6;
}

.topic-L0 {
font-size: 30px;
text-indent: 0px;
}

.topic-L1 {
font-size: 25px;
text-indent: 18px;
}

.topic-L2 {
font-size: 20px;
text-indent: 36px;
}

.topic-L3 {
font-size: 15px;
text-indent: 54px;
}
The CSS is passed into the Dashboard with
with open('styles.css', 'r') as f:
    css = f.read()

with gr.Blocks(css=css) as demo:
	# ...
An example topic detection output can be found in the Detected Topics section.
Sentiment Analysis
The sentiment analysis information in the AssemblyAI response JSON has the following form, where each sentence is prescribed a "POSITIVE", "NEGATIVE", or "NEUTRAL" sentiment.
  "sentiment_analysis_results": [
    {
      "text": "You will never believe what happened to me last week.",
      "start": 1150,
      "end": 4674,
      "sentiment": "NEGATIVE",
      "confidence": 0.5470982193946838,
      "speaker": "A"
    },
    "...",
    {
      "text": "What are you doing this weekend?",
      "start": 98050,
      "end": 99430,
      "sentiment": "NEUTRAL",
      "confidence": 0.8970483541488647,
      "speaker": "A"
    }
  ]
To process this data for display on our Dashboard, we use the make_sentiment_output() function in helpers.py. This function simply iterates through the above, using the HTML <mark> tag to highlight the text green or red (or not at all) according to the value associated with the sentiment key.
def make_sentiment_output(sentiment_analysis_results):
    p = '<p>'
    for sentiment in sentiment_analysis_results:
        if sentiment['sentiment'] == 'POSITIVE':
            p += f'<mark style="{green + to_hex(sentiment["confidence"])}">' + sentiment['text'] + '</mark> '
        elif sentiment['sentiment'] == "NEGATIVE":
            p += f'<mark style="{red + to_hex(sentiment["confidence"])}">' + sentiment['text'] + '</mark> '
        else:
            p += sentiment['text'] + ' '
    p += "</p>"
    return p
An example sentiment analysis output can be found in the Sentiment Analysis section.
Entity Detection
The entity detection information in the AssemblyAI response JSON has the following form, where the detected entity is identified via text as an entity of the class entity_type.
"entities": [
    {
      "entity_type": "location",
      "text": "South Boston",
      "start": 12884,
      "end": 13678
    },
    "...",
    {
      "entity_type": "medical_process",
      "text": "physical therapy",
      "start": 80504,
      "end": 81274
    }
  ]
To process this data for display on our Dashboard, we use the make_entity_html() function in helpers.py. It simply iterates through the above list, creating a dictionary where each key is an identified entity_type whose value is a list of each detected entity (e.g. "South Boston") of that entity type, along with the surrounding words in the transcription for context. If the identified entity has been redacted via e.g. PII redaction, the text is instead replaced with "[REDACTED]".
def make_entity_dict(entities, t, offset=40):
    len_text = len(t)

    d = {}
    for entity in entities:
        s = t.find(entity['text'])
        if s == -1:
            p = None
        else:
            len_entity = len(entity['text'])
            p = t[max(0, s - offset):min(s + len_entity + offset, len_text)]
            p = '... ' + ' '.join(p.split(' ')[1:-1]) + ' ...'
        label = ' '.join(entity['entity_type'].split('_')).title()
        if label in d:
            d[label] += [[p, entity['text']]]
        else:
            d[label] = [[p, entity['text']]]

    return d
This dictionary is then converted to HTML, similarly to Detected Topics above, using the make_entity_html() function in helpers.py. This function displays each entity type in purple at the highest level of an HTML list, with each entity type instance displayed below it in a sublist, with the identified entity highlighted in yellow.
def make_entity_html(d, highlight_color="#FFFF0080"):
    """Input is output of `make_entity_dict`. Creates HTML for Entity Detection info"""
    h = "<ul>"
    for i in d:
        h += f"""<li style="color: #6b2bd6; font-size: 20px;">{i}"""
        h += "<ul>"
        for sent, ent in d[i]:
            if sent is None:
                h += f"""<li style="color: black; font-size: 16px;">[REDACTED]</li>"""
            else:
                h += f"""<li style="color: black; font-size: 16px;">{sent.replace(ent, f'<mark style="background-color: {highlight_color}">{ent}</mark>')}</li>"""
        h += '</ul>'
        h += '</li>'
    h += "</ul>"
    return h
An example entity detection output can be found in the Entity Detection section.
Content Safety
The content safety information in the AssemblyAI response JSON has a relatively complicated structure, so we isolate the "summary" information below:
"content_safety_labels": {
    "...",
    "summary": {
      "accidents": 0.2611353717731301,
      "alcohol": 0.46347422408861444,
      "crime_violence": 0.27030136438470115
    },
}
Each detected sensitive topic is listed out with a value denoting how present each topic is in the text on a scale of 0 to 1. To prepare this information for display on our Dashboard, we simply use plotly to plot these values in a chart using the make_content_safety_fig() function from helpers.py
def make_content_safety_fig(cont_safety_summary):
    d = {'label': [], 'severity': [], 'color': []}

    for key in cont_safety_summary:
        d['label'] += [' '.join(key.split('_')).title()]
        d['severity'] += [cont_safety_summary[key]]
        d['color'] += ['rgba(107, 43, 214, 1)']

    # Create the figure (n.b. repetitive color info but was running into plotly/Gradio bugs)
    content_fig = px.bar(d, x='severity', y='label', color='color', color_discrete_map={
        'Crime Violence': 'rgba(107, 43, 214, 0.1)',
        'Alcohol': 'rgba(107, 43, 214, 0.1)',
        'Accidents': 'rgba(107, 43, 214, 0.1)'})

    # Update the content figure plot
    content_fig.update_layout({'plot_bgcolor': 'rgba(107, 43, 214, 0.1)'})

    # Scale axes appropriately
    content_fig.update_xaxes(range=[0, 1])
    return content_fig
An example content safety output can be found in the Content Safety section.
Running and Deploying the Dashboard
After defining all components and functionality as above in app.py, the app can simply be launched by adding the below to the end of the file (outside of the gr.Blocks() block):
demo.launch()The terminal will display a local URL at which the Dashboard can be accessed. To get a shareable link for the app, simply add share=True as a keyword argument:
demo.launch(share=True)Dark/Light Mode Note
Gradio has a "dark" mode and a "light" mode, which changes the default look of an app. Depending on your OS and browser, the Dashboard may display in dark mode. In Gradio 3.2, there is no way to force an app to display as on theme or another in Python. You can, however, force light mode by appending ?__theme=light to the URL output by running app.py.
The Audio Intelligence Dashboard is intended to be run in light mode, so if you see dark mode when running locally, try the above method to force the app to display in light mode
The output public URL will be active for 72 hours, but if you terminate the process that is running app.py, clicking the link will yield a 502 error. In order to create a persistent instance of the app, we will leverage Hugging Face Spaces. Spaces allows you to easily deploy a Gradio (or Streamlit or Static) app in just a few minutes. Let's take a look at how to do so now.
Deploying the Dashboard to Spaces
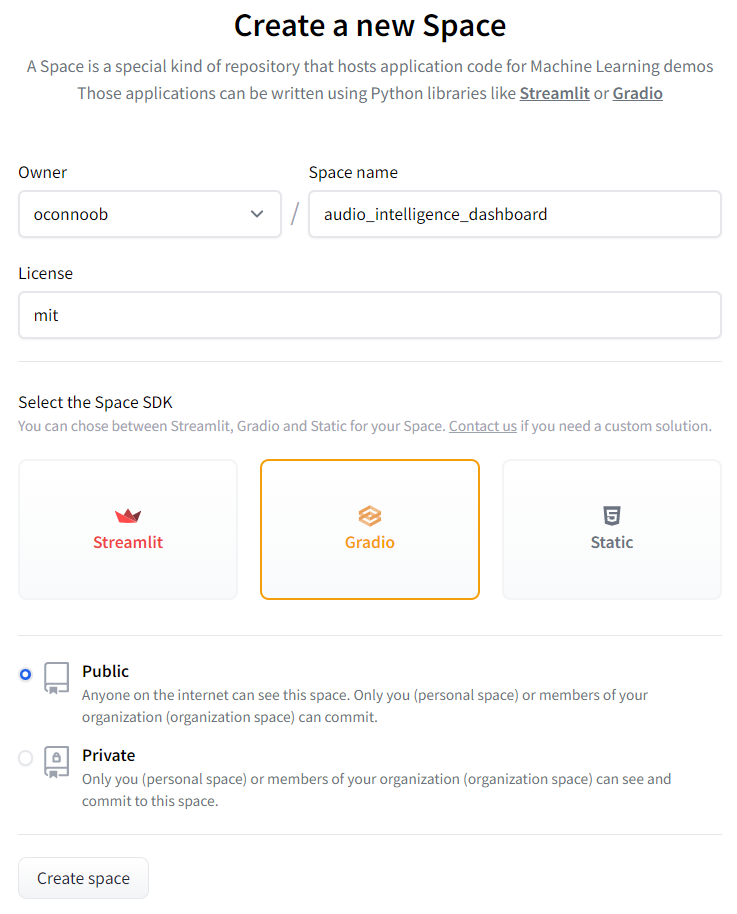
First, go to Spaces and log into your Hugging Face account (or create one if you don't have one already). Then select Create new Space:
Fill out all necessary information in the resulting screen, selecting Gradio for the Space SDK, and then click Create Space at the bottom.
Now that the Space is created, we need to upload the Dashboard code to it. In a terminal, navigate into the Dashboard project repository and execute the following command:
git remote add space https://huggingface.co/spaces/FULL_SPACE_NAMEReplace FULL_SPACE_NAME with your username and the Space name. For example, the full command used in deploying this dashboard was:
git remote add space https://huggingface.co/spaces/oconnoob/audio-intelligence-dashboardThis command adds the Space as a remote for the repository, meaning that we can upload the code to this remote location using git. In order to do this, we execute the following command:
git push --force space master:main
We upload the code with git push (in a forceful way using --force because the Space is empty) to the remote specified by space, which is the Hugging Face Space we just added. master:main tells git to push the master branch of the project repository to the main branch in the remote space repository.
Additional Details
We specify the branches in this manner because the default branch name in Spaces is main, but the main branch in our local repository is called master, so to get our app to display we must specify that we are pushing to main in the remote from master locally.
Note that for other projects your default branch may be named main, meaning that you can omit master:main from the above command. To check the name of the branch you are on in a git repository, execute git branch in the terminal and find for the branch name with an asterisk next to it.
That's all it takes to deploy the Audio Intelligence Dashboard to Spaces! If you would like to set up an application to automatically update alongside changes to a GitHub repository, check out Managing Spaces with GitHub Actions.
Project extensions
This project serves as a thorough introduction to Gradio, but there are certainly some fun extensions that those looking to dive deeper can implement for practice. We've listed a few out below, but if you've seen everything you wanted to, feel free to jump down to some final words.
Threshold Sliders
There are several different parameters that use constant values which can be made variable. For example, the make_html_from_topics() function has a threshold argument that provides a lower bound on the relevance a topic must have to be displayed.
Currently, this threshold uses the default value of 0.0, meaning that no topics are filtered out. One extension to the Audio Intelligence Dashboard could be to implement a Gradio Slider that controls this threshold, allowing users to select how aggressive they'd like to be in filtering.
create_highlighted_list() and make_entity_dict() have similar arguments (rank and offset respectively) for which sliders could also be implemented. The great thing about this extension is that the Python is already written to accomodate it, so all that's needed is to create the Gradio "wiring".
Bonus
As a bonus challenge, try to make the effects of these sliders dynamic. That is, rather than choosing e.g. a threshold with a slider ans statically displaying the results, allow the user to use the slider on the displayed results, dynamically changing which topics are displayed.
Save & Import Results
Consider creating a way to save an executed analysis, perhaps by saving the response JSON and adding the ability for users to upload saved JSON to re-display it (without having to run an identical analysis).
API Key Requirement
Currently, no API key is required to use the Dashboard. Consider implementing a feature in which an API key must be entered to "access" the dashboard. This is a relatively easy extension, requiring only components to be made (in)visible.
Alternatively, consider making the Dashboard more robust by handling misuse, such as when Submit is clicked with no API Key having been entered.
Modify CSS
If you are looking to practice your CSS, try modifying styles.css to change how the displayed outputs look. In addition, consider looking into the elem_id argument to fine-tune appearances. Note that, in general, HTML elements are the easiest to modify with Gradio and there is currently no easy way to significantly shape the appearance of the app as a whole.
Final Words
That's it for this tutorial! If you enjoyed this article, feel free to subscribe to our newsletter below, or check out some other articles on our Blog, like tutorials on running Stable Diffusion or building your own text-to-image model.
Alternatively, check out our YouTube channel for other awesome content, like our Machine Learning from Scratch series!


