Can Podcasts Predict the Stock Market?
Can the frequency of negative news in popular news podcasts like The Daily and Up First predict Stock Market performance? We do the analysis in this blog post!


Everyone wants to know how to predict the stock market. Everyone also knows that it’s basically impossible. Here at AssemblyAI, we wanted to know if the negative events in news podcasts could predict the stock market in some way. In this post, we’re going to walk through how to compare podcast data to stock market data and what the news negativity ratings last year of two prominent news podcasts, The Daily and Up First, had to say about the stock market last year, specifically the Dow Jones Industrial Average, the NASDAQ, and Royal Gold.

How Did We Use Negative News in Podcasts to Predict the Market?
We took the audio files of the podcasts The Daily and Up First and transcribed them with AssemblyAI’s automatic speech to text transcription API. AssemblyAI’s speech to text API also provides the option to enable content safety ratings which detect negative news. We used this option when passing the audio files to the speech to text API endpoint to detect negative news in each podcast episode. The returned response from the AssemblyAI API with this option looks like:
{ "text": "Five terms. Speaker Joe Straus says he will not run for reelection state representative next year from San Antonio. And in late 2017, he announces that he'll step down before the 2019 session. From now on, far right. Republicans will have more sway. It's virtually the end of any sort of moderate strain of Republicanism in Texas. As one professor put it, the political center of the state collapsed today. Wow. That sounds like a real end of an era.", "labels": [ { "confidence": 0.949425995349884, "label": "negative_news" } ], "timestamp": { "start": 665780, "end": 695530 } }
Each paragraph that is returned has a label with a confidence score and a timestamp.
We labeled each episode with a negativity rating that was equal to the proportion of negative news in the audio file, for example if there were 50 blocks of text returned and there were 5 mentions of negative news (above 85% confidence), the audio file would have a negativity rating of 0.1.
Key Findings
From the graphs, it looks like our most negative news days come 1-3 days before rises in gold as well as dips in the market. We can zoom in and confirm that this is true with the graphs below. Almost every blue line - demarcating a date with exceptionally negative news - is followed by a dip or series of red days on both DJIA and NDAQ, and is followed by a rise or a series of green days on RGLD.


So what does this mean for you practically? If you’re hearing really negative news maybe you want to buy the dip in the next 1-3 days unless you’re looking at gold prices. If you want to explore this on your own, we’ll take a deep dive into the code so you can do this process yourself.
Steps
- Create a Python Web Crawler to collect links to audio files
- Transcribe the audio files with AssemblyAI’s speech to text API
- Calculate and compile Negativity News Ratings
- Download Stock Data
- Graph negative News Ratings against the DJIA, NDAQ, and RGLD
- ???
- Profit
Create a Python Web Crawler to Collect links to Audio Files
We’re going to use Selenium to crawl Listen Notes and get links to the podcasts of The Daily and Up First (in this example code the link is to Up First).
To Install Selenium, run:
pip install selenium
We’ll use Selenium and Chromedriver to open up the link in Chrome. Then we’ll look for the ‘Load More’ button and click it 36 times in order to get all the podcasts from the last year. After we’ve extended our page, we’ll then get the ‘Download’ link from clicking the ‘MORE’ button and getting the ‘href’ value of the link to the ‘Download’ button. We’ll save all of these in a .csv file and use that to transcribe our links later.
""" Downloads a specified number of podcasts from a specific podcast using Selenium """ from selenium import webdriver from selenium.webdriver.common.keys import Keys from selenium.webdriver import ActionChains from time import sleep from random import randint # download last 365 the daily podcasts # download last 365 up first podcasts chromedriver_path = './chromedriver' driver = webdriver.Chrome(executable_path=chromedriver_path) sleep(randint(1, 3)) driver.get('https://www.listennotes.com/podcasts/up-first-npr-e0zpMGZKNYd/#podcast') sleep(randint(2, 3)) dl = 0 links = [] for i in range(37): actions = ActionChains(driver) load_more = driver.find_element_by_xpath("//button[contains(., 'Load more')]") actions.move_to_element(load_more).click().perform() sleep(randint(1, 3)) while dl < 366: more_button = driver.find_elements_by_link_text("MORE") for link in more_button: actions = ActionChains(driver) actions.move_to_element(link).click().perform() dl += 1 sleep(randint(1, 3)) dlinks = driver.find_elements_by_css_selector("a[title*='Download audio file']") for dlink in dlinks: links.append(dlink.get_attribute("href")[:-1]+'.mp3') with open('upfirst_links.csv', 'w') as _file: for link in links: _file.write(link) _file.write(",")
When you’re done, you should have a .csv file that looks something like this:

Transcribe the audio files with AssemblyAI’s speech to text API
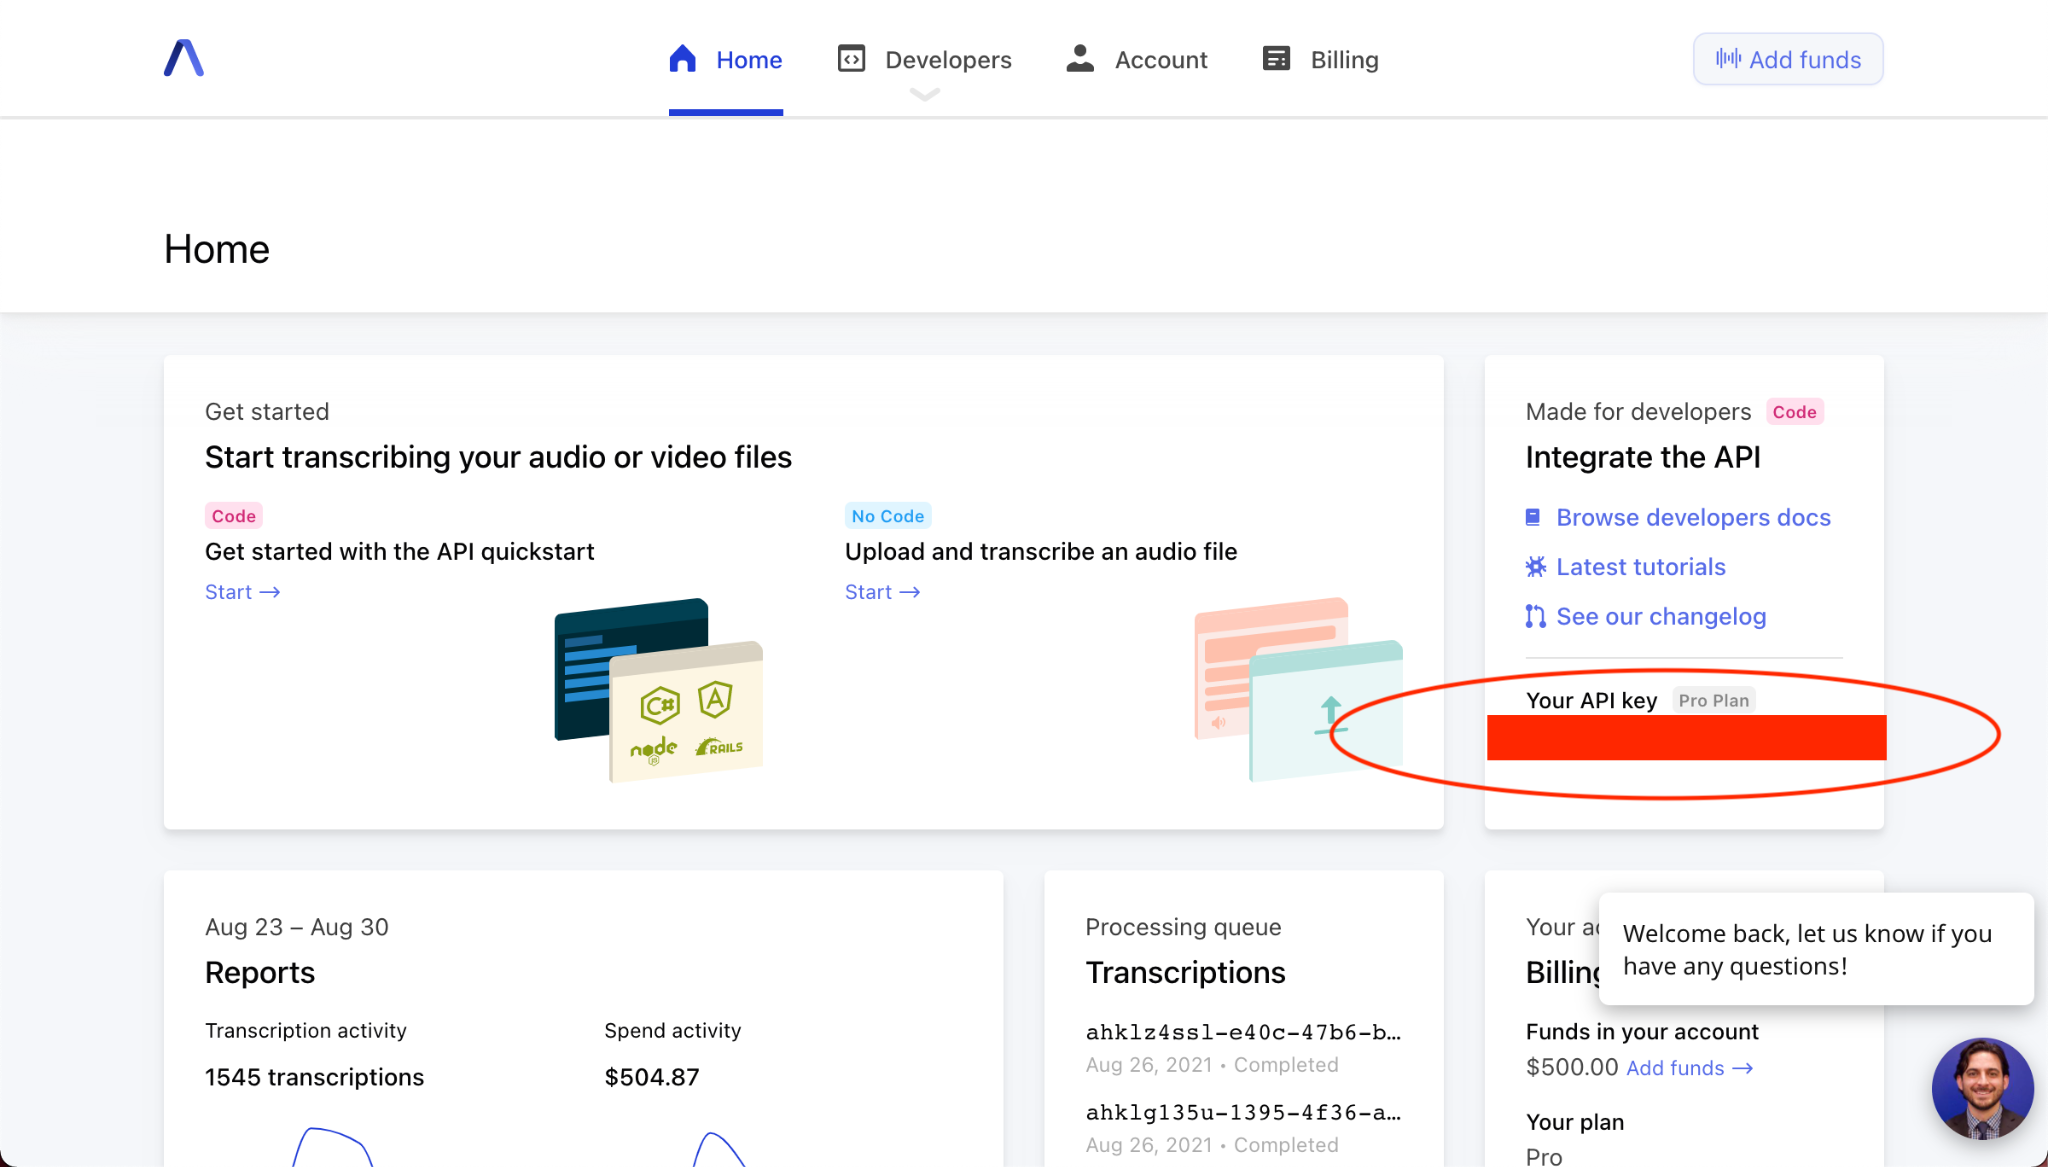
Now that we’ve got our links we will use AssemblyAI’s AI powered automatic speech recognition API endpoint and get content safety ratings for each of our podcasts. It’s important to note here that we are running a LARGE amount of audio through. We are running AI transcription on roughly 700 podcasts of half an hour each, that’s at least 300 hours of audio. It would take a person almost 13 days, likely more, to transcribe that. We’re going to do it with AssemblyAI’s automatic speech to text API in a day. We’ll need to sign up for an AssemblyAI API key, which will be located where I blocked out in the picture.
After we get our API key, we’ll create a function to actually allow us to transcribe the code. We’ll create multiple functions to do this. First we’ll create a function that allows us to transcribe the audio files using AssemblyAI’s speech to text API. We’ll need the transcript endpoint, headers with authorization, and some constants to help us run our program - one to let us know the status of the transcript processing and another to help us run multiple transcripts at a time. We’ll also make functions to poll the AssemblyAI speech to text API, and to save the transcript to a file if the status of the transcript is complete.
import requests from config import auth_key import json import os import csv transcript_endpoint = "https://api.assemblyai.com/v2/transcript" headers = { "authorization": auth_key, "content-type": "application/json" } INCOMPLETE = 'Incomplete' NUMBER = 20 # Parameters: audio_url - link to audio # Returns: transcript_id - transcript id corresponding to AssemblyAI transcription id # send a transcription request to the AssemblyAI transcript endpoint # this one contains true for content safety so we can get negative news labels def transcribe(audio_url): transcript_request = { 'audio_url': audio_url, 'content_safety': 'True' } transcript_response = requests.post( transcript_endpoint, json=transcript_request, headers=headers) transcript_id = transcript_response.json()['id'] return transcript_id # Parameters: transcript_id - transcript id corresponding to AssemblyAI transcription id # Returns: transcript_id (same) or INCOMPLETE status # polls the transcription endpoint of the id to see if the transcription is done # will also return an exception if there is an error def poll(transcript_id): polling_endpoint = transcript_endpoint + "/" + transcript_id print("Transcribing at", polling_endpoint) try: polling_response = requests.get( polling_endpoint, headers=headers) if polling_response.json()['status'] == 'completed': save_transcript(polling_response) return transcript_id else: return INCOMPLETE except Exception as err: print(f"Exception occured {err}") # edit before running for each podcast # Parameters: response - a response object from AssemblyAI # saves the content safety labels returned from AssemblyAI to the folder # of the podcast that we are currently processing def save_transcript(response): transcript_id = response.json()['id'] content_filename = transcript_id + '_content.json' with open('./upfirst_transcripts/' + content_filename, 'w') as f: f.write(json.dumps(response.json()['content_safety_labels'])) print('Content safety saved to', content_filename)
Now that we’ve created functions to handle transcribing our audio via AssemblyAI’s speech recognition API, we need to create some functions to handle running so many files through. We’ll make a function that will append files to a .csv that tracks the links we have already checked and transcribe and we’ll create a function that will keep track of the current transcription ids that are being processed via AssemblyAI’s speech to text API. Then comes the script.
Our script will open up a csv file containing links to the podcast audio files. It will check to see if we have already created a csv for checked links and check for a csv of currently running transcript ids. If the number of checked links is equal to the number of total links, we’re done. If not, we remove the checked links from our list of links.
# Parameters: link - the link to the audio file we have processed # writes link as a new row to the csv def append_file(link): with open('checked_links.csv', 'a') as _file: writer = csv.writer(_file, delimiter=',') writer.writerow([link]) # Parameters: transcript_ids - a list of AssemblyAI transcription ids # saves the current batch of transcripts being processed def write_transcripts(transcript_ids): with open('transcript_ids.csv', 'w') as _file: writer = csv.writer(_file, delimiter=',') for transcript_id in transcript_ids: writer.writerow([transcript_id]) # read the links we have for the podcast with open('upfirst_links.csv', newline="") as _file: reader = csv.reader(_file) links = list(reader) # read which links we have that have already been checked if os.path.exists('checked_links.csv'): with open('checked_links.csv', newline="") as _file: reader = csv.reader(_file) checked_links = list(reader) else: checked_links = [] # check if we have any existing files being transcribed if os.path.exists('transcript_ids.csv'): with open('transcript_ids.csv', newline="") as _file: reader = csv.reader(_file) transcript_ids = list(reader) else: transcript_ids = [] # check if we've already checked all the links if len(checked_links) == len(links): print("Done") exit() # remove items in checked_links from links for checked in checked_links: links.remove(checked)
If we already have a set of transcription ids from AssemblyAI’s speech to text transcription API, we’ll poll for a status. We’ll count the number of files that are completed, and then replace them in order. Of course this won’t always preserve chronological order, but we can actually do that by polling at a rate in which we can expect all the audio to already be transcribed. The AssemblyAI’s speech to text AI transcription service has a transcription time that can be safely estimated at ⅓ of the audio file length.
# this is a list of one element lists # transcript_ids should just be the first NUMBER elements in links if transcript_ids: poll_responses = [poll(transcript_id[0]) for transcript_id in transcript_ids] _completed_indices = [] for index, res in enumerate(poll_responses): if res != INCOMPLETE: _completed_indices.append(index) # remove completed indices print(f"These are the completed indices {_completed_indices}") if _completed_indices: if len(_completed_indices) != NUMBER: transcript_ids = [id for index, id in enumerate(transcript_ids) if index not in _completed_indices] current_links = links[:NUMBER] processed_links = [link for index, link in enumerate(current_links) if index in _completed_indices] else: transcript_ids = [] processed_links = links[:NUMBER] # add x new transcripts added_links = links[NUMBER:NUMBER+len(_completed_indices)] # add each processed link to checked links and write to csv for link in processed_links: append_file(link[0]) # request new transcripts for added links for link in added_links: transcript_ids.append(transcribe(link[0])) write_transcripts(transcript_ids) else: current_links = links[:NUMBER] for link in current_links: transcript_ids.append(transcribe(link[0])) write_transcripts(transcript_ids)
We run this script multiple times until we’ve finished transcribing all of the links in our file. After we’re done transcribing our links, we should end up with a folder that contains JSON files with blocks of text that look like this.
{ "text": "Five terms. Speaker Joe Straus says he will not run for reelection state representative next year from San Antonio. And in late 2017, he announces that he'll step down before the 2019 session. From now on, far right. Republicans will have more sway. It's virtually the end of any sort of moderate strain of Republicanism in Texas. As one professor put it, the political center of the state collapsed today. Wow. That sounds like a real end of an era.", "labels": [ { "confidence": 0.949425995349884, "label": "negative_news" } ], "timestamp": { "start": 665780, "end": 695530 } }
Calculate and compile Negativity News Ratings
After running all of our audio files through AssemblyAI’s speech to text API and getting JSON files back with content safety labels, we can now start to calculate and compile negative news ratings. This part gets a bit complex and is not entirely precise so buckle your seatbelts. I made the unfortunate mistake of not saving the dates corresponding to the podcasts when I initially downloaded them and I thought I was doomed, but then I realized that I could just backdate them by the order in which I downloaded them, starting with August 21, 2021. The first thing we’re going to do is get a list of the negativity ratings of each news podcast. This list will be in chronological order. The function that we’ll use to get these negativity ratings is:
def negativity_ratings(content_files): neg_ratings = [] for filename in content_files: with open(filename, 'r') as _file: content = json.load(_file) negative_news_mentions = 0 total = 0 for result in content['results']: total += 1 for entry in result['labels']: if entry['confidence'] > 0.85 and entry['label'] == 'negative_news': negative_news_mentions+=1 if total == 0: print(f"Error with {filename}") continue neg_ratings.append(negative_news_mentions/total) return neg_ratings
We’re going to create three negativity ratings by running this on The Daily, Up First, and then creating a third that combines their ratings. We’re also going to normalize our data to be between 0 and 1 and turn it into a measure of the negativity of the news with 0 being the most negative days and 1 being the least negative days instead of 0 being no mentions of negative news and 1 being an entirely negative podcast.
daily_negs = negativity_ratings(daily_content_files) upfirst_negs = negativity_ratings(upfirst_content_files) congregate = [i + j for i, j in zip(upfirst_negs, daily_negs)] _max = max(congregate) normed_congregate = [1-float(e)/_max for e in congregate] _max = max(upfirst_negs) normed_upfirst = [1-float(e)/_max for e in upfirst_negs] _max = max(daily_negs) normed_daily = [1-float(e)/_max for e in daily_negs]
We’ll find the indices corresponding to the minimum values in all three of these lists using a function that returns the 10 minimum indices. Then we’ll coalesce these indices and graph them against the graphs of the Dow Jones Industrial Average, the NASDAQ, and Royal Gold.
def get_min_indices(normed_function): min_indices = [] vals = sorted(set(normed_function)) for i in range(10): index = normed_function.index(vals[i]) min_indices.append(index) return min_indices min_congregate_indices = sorted(get_min_indices(normed_congregate)) min_daily_indices = sorted(get_min_indices(normed_daily)) min_upfirst_indices = sorted(get_min_indices(normed_upfirst))
Compiling the days, we find that they are:
- August 13, 2021
- July 14, 15, and 16, 2021
- July 8, 2021
- July 3, 2021
- June 1, 2021
- May 4, 2021
- March 18, 2021
- February 14, 2021
- January 25, 2021
- October 21, 2020
Download Stock Data
We can download stock data with Yahoo Finance’s Python SDK. You can install yfinance by running:
pip install yfinance
Then we can download last year’s stock market data like so
start = datetime.datetime(2020,8,21) end = datetime.datetime(2021,8,21) symbol = 'DJIA' try: stock = yf.download(symbol, start=start, end=end, progress=False) stock['Name'] = symbol stock.to_csv(f'./stocks/{symbol}.csv', index=False) except Exception as err: print(f"Error occurred {err}")
Graph negative News Ratings against the DJIA, NDAQ, and RGLD
We’re going to create some candlestick charts in Python so that we can graph our stock data. We’ll need to have pandas, matplotlib, and mplfinance for this. To download these you can run
pip install matplotlib mplfinance
We'll read our file in and add labels.
import csv import pandas as pd def get_ohlc(filename): with open(filename, newline="") as _file: reader = csv.reader(_file) arr = pd.DataFrame(reader) ohlc = arr.loc[1:,0:3] ohlc.columns = ['Open', 'High', 'Low', 'Close'] try: ohlc = ohlc.astype(float).dropna() except ValueError as err: print(err) return [], [] dates = [i for i in range(0, len(ohlc))] ohlc.insert(0, 'Dates', dates) return ohlc
Before we plot this, we’ll want to normalize our data.
fig, ax = plt.subplots() ohlc = get_ohlc(entry) # add 1 to make sure there's no "drop off" candlesticks that disappear ohlc['Open'] -= min(ohlc['Open'])+1 ohlc['Open'] /= max(ohlc['Open']) ohlc['Close'] -= min(ohlc['Close'])+1 ohlc['Close'] /= max(ohlc['Close']) ohlc['High'] -= min(ohlc['High'])+1 ohlc['High'] /= max(ohlc['High']) ohlc['Low'] -= min(ohlc['Low'])+1 ohlc['Low'] /= max(ohlc['Low']) candlestick_ohlc(ax, ohlc.values, width=0.6, colorup='green', colordown='red', alpha=0.8)
Now we go back to the dates that we identified that had the most negativity in The Daily and Up First Podcasts that we transcribed with AssemblyAI’s speech to text API and plot them as vertical lines like
for i in z: plt.axvline(i)
We should then see graphs like the ones below.
How to read these graphs
These candlestick graphs are zoomed in to the days of particular negative news. The y-axis is scaled from 0 to 1 because a) normalizing a set of nonnegative numbers to this scale is a shape preserving transformation and b) if we want, we can plot the frequency of negative news in the podcasts against this scale and see how it lines up in a more absolute manner. I’ve chosen not to include these graphs because they’re harder to read than the ones I have included. The negative news peaks are marked with vertical blue lines.
Let’s zoom in and examine the days around our particularly negative news. As I said earlier, it looks like the price of gold is inversely related to negative news peaks and the price rises for the days after and it looks like the NASDAQ and DJIA are directly correlated with negative news peaks and have their prices drop in the days after.


In this first graph, we see a sharp rise in gold with a lag of 1 day behind the negative news peak along with a surprise drop immediately the day after. We can also see that the NASDAQ had a pretty big dip in the days after. The DJIA does not reflect as much of a drop so I didn’t include the graph. This was around the time Google was facing anti-trust issues and global protests.

This graph shows us another jump in gold immediately after this negative news day. I already included this date for the NASDAQ in the graph above, and once again the DJIA showed not as drastic of a change. I think this was around the election.


Here we see a pretty big rise in the price of gold in the days following another negative news peak. This time we can see a response from both the DJIA and the NASDAQ with prices dropping on both indexes in the days after this cluster of negative news. I believe these news points were around the time when there was a vaccine controversy in Texas and a rise in racial violence against Asian Americans.

There’s another rise in the price of gold immediately after another negative news peak here. The NASDAQ and the DJIA did not respond strongly to this negative news. This was around the time that there were many protests around racial violence in the US.


This rise in gold price following negative news was around the time that the COVID delta variant was becoming more widespread. We can see that the DJIA and NASDAQ also responded to this news with drops the next few days with DJIA really taking a dip right after.


This last graph for gold prices shows rises around late July of 2021. We can see that the NASDAQ and DJIA both responded to this and took dips in the days after. This was around the wildfires in the west and more concern around climate change. I’m not sold that buying gold will protect anyone from climate change, but a rise in commodity prices as a fear response to negative news always makes sense.
Conclusion
Can you use podcasts to predict the stock market? Most of the time no, but on days with exceptionally bad news, you can expect to see a dip in the stock market in the next 1-3 days. How bad is exceptionally bad? I arbitrarily chose the top 10 worst days over the last year, and combined two sets of them to find that these days did indeed predict drops. Their negativity ratings via AssemblyAI’s content safety option on the speech to text API were all over 0.7. For more information on speech to text and other cool tutorials follow us @assemblyai and @yujian_tang on Twitter!
Lorem ipsum dolor sit amet, consectetur adipiscing elit, sed do eiusmod tempor incididunt ut labore et dolore magna aliqua. Ut enim ad minim veniam, quis nostrud exercitation ullamco laboris nisi ut aliquip ex ea commodo consequat. Duis aute irure dolor in reprehenderit in voluptate velit esse cillum dolore eu fugiat nulla pariatur.